Safety stock is essential in inventory management to avoid stockouts caused by demand or supply variability. This guide covers various safety stock formulas, including the Average-Max and statistical methods, to help you determine optimal safety levels.
And since you’ll find many ways to calculate it on Google—some of which may seem complicated—I’ll explain the main calculation methods simply, using Excel, and share the ones I recommend.
Step-by-Step video tutorial: how to calculate safety stock in Excel

Safety Stock Definition
The safety stock (or buffer stock) is the stock level that limits stock shortages due to unforeseen events (forecasts not in line with demand, longer than expected supply time, etc…) and helps to smooth out your supply chain.
Why do you need safety stock?
You need a safety stock to cover yourself against two hazards or uncertainties: demand and lead time.
1) Demand uncertainty
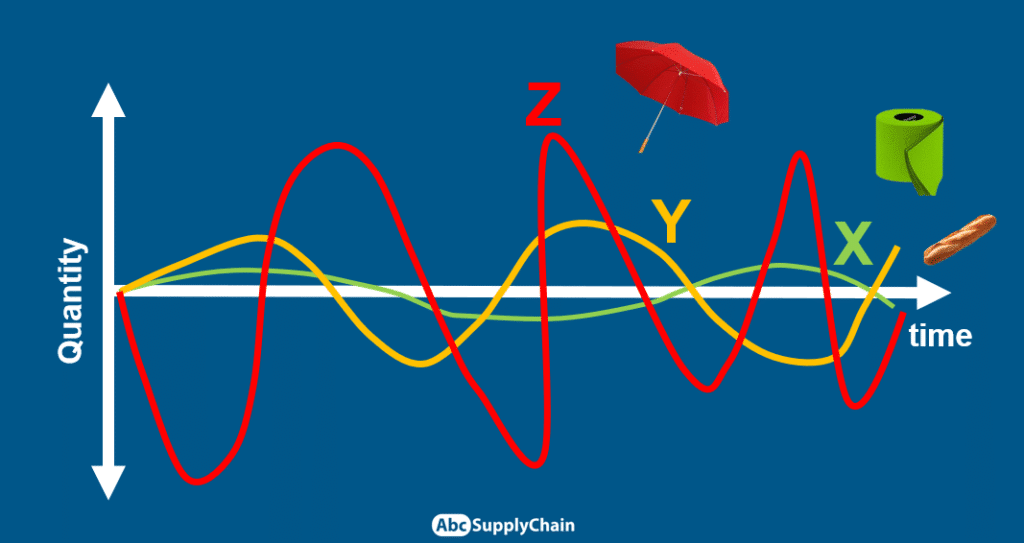
Products have different levels of demand uncertainty.
For example, in every supply chain there are stable products such as toilet paper, and others much more uncertain, such as umbrellas – which are sold only during rainy periods. You will probably have a better forecast quality on toilet paper than on the umbrella. You might have a stronger safety stock on the umbrella to cover higher risks of shortages and lost sales.
2) Lead Time uncertainty (or supply uncertainty)
There are also supply hazards: specifically, lead time uncertainty.
Indeed, there are many factors impacting the total lead time:
- Review period: how often you order
- IT confirmation delay / Purchase Order delays
- Production lead time
- Picking/Packing time in the warehouse or factory
- Waiting time before shipping
- Transportation time / transit time
- Customs
- Delivery time
Any hazard over one of those factors directly impacts the lead time, and so the risk of shortage or overstock.
Let’s take the following supply chain example: you produce in China and you deliver in France, with an average lead times of 40 days. You have different supply hazards: missing raw materials, higher production lead times than expected, natural disaster, third-party transportation problems, customs clearance delays, customer demand, or even IT issues. Then, your lead times highly varies, with some deliveries arriving early and others arriving much later than your average lead times.
The distribution of your products’ lead times looks like this:
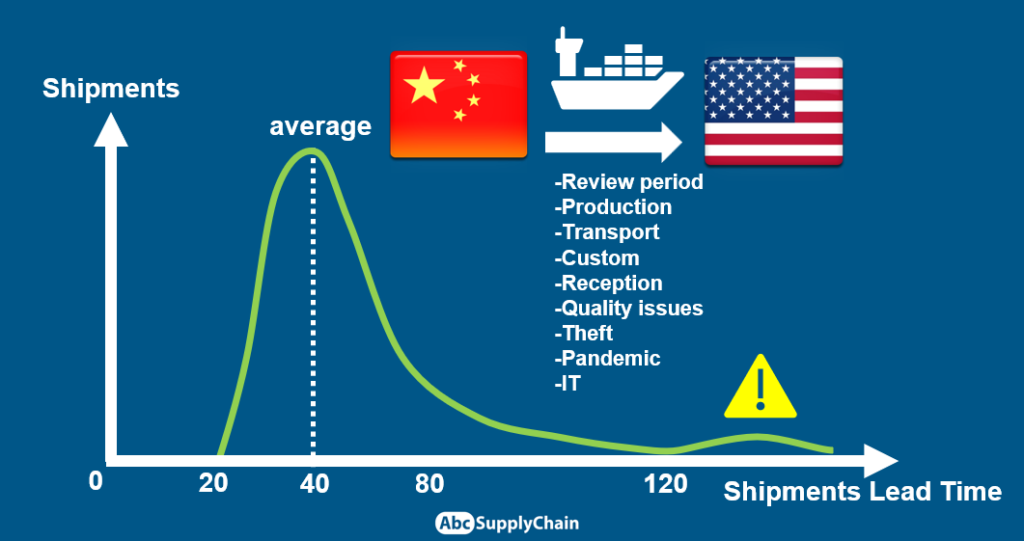
Because most of the time you cannot predict when those issues happen, you need safety stock to cover supply uncertainties.
Safety Stock with EOQ (Economic Order Quantity)
The basic Safety Stocks scenario follows a Continuous Review Policy: quantities to order are fixed.
The optimal quantity to order in terms of cost savings is the EOQ (Economic Order Quantity). To know more about EOQ, check out my article: EOQ formula with examples in Excel.
We can then combine EOQ with Safety Stock to ensure optimized ordering quantities and protection against uncertainty.
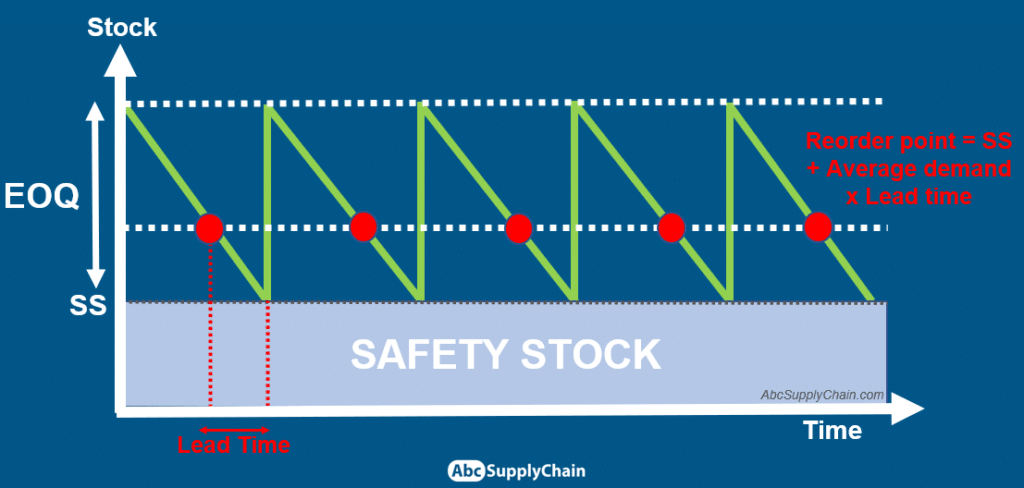
Safety Stock Reorder point definition
The reorder point is the stock level at which we need to replenish inventory. We make an order when we reach the Reorder Point, and we receive the item when we reach the safety stock level.
Reorder Point formula:
RP = Safety Stock + Average Sales × Lead time
This is in theory, but in reality, supply and demand are much more chaotic. This is why we use Safety Stock.
Risks related to safety stock
Before considering the formulas, I would like to stress the risks involved in safety stock. Safety stock can be reassuring, but it often reflects fundamental problems: poor data accuracy, poor forecast accuracy, outdated IT systems, lack of communication with suppliers… Typically, maintaining high safety stock is a trick to hide the root causes of our issues. If you hold unnecessary stock levels to cover all those issues or customer demand, you will have unreasonably high stock costs.
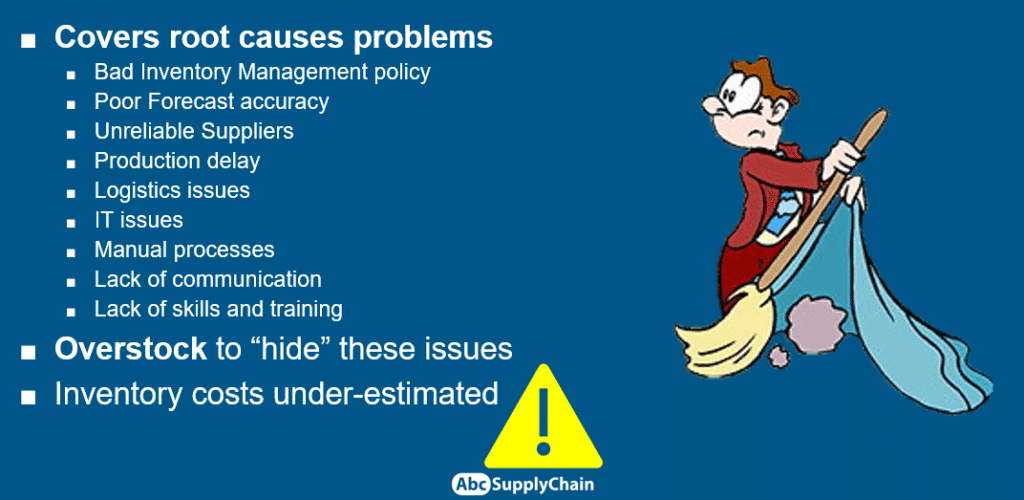
I advise you to be vigilant about the safety stock and focus on the fundamental issues above.
The Safety stock goal is to find the right balance between the customer service rate and inventory cost.

Safety Stock Formula : 6 different calculations
We will go through 6 safety stock inventory formula for your safety stock (or buffer stock), from the simplest to the most complex one.
Method 1: Basic Safety Stock Formula
The first safety stock calculation formula is the most basic method, which I also call “the old-fashioned way”.
Simply put, we want to “secure X days of supplies”, so we need to estimate “safety days”.
Let’s say you have an average sale of 100 quantities per day for a product with an average lead time of 10 days. From experience, you know that owning 5 days of supplies is enough to mitigate supply and demand risks.
Safety Stock formula and Calculation:
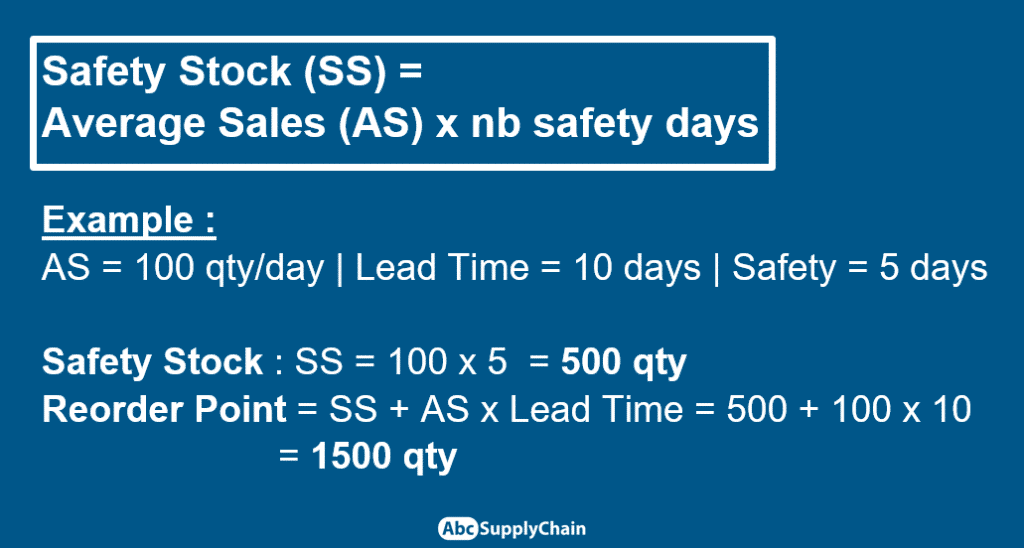
So your safety stock is simply 100 × 5 = 500 pieces. This gives us a Reorder Point of 1500 pieces.
If we assume the EOQ to be 2000, then the stock level versus time looks like this:
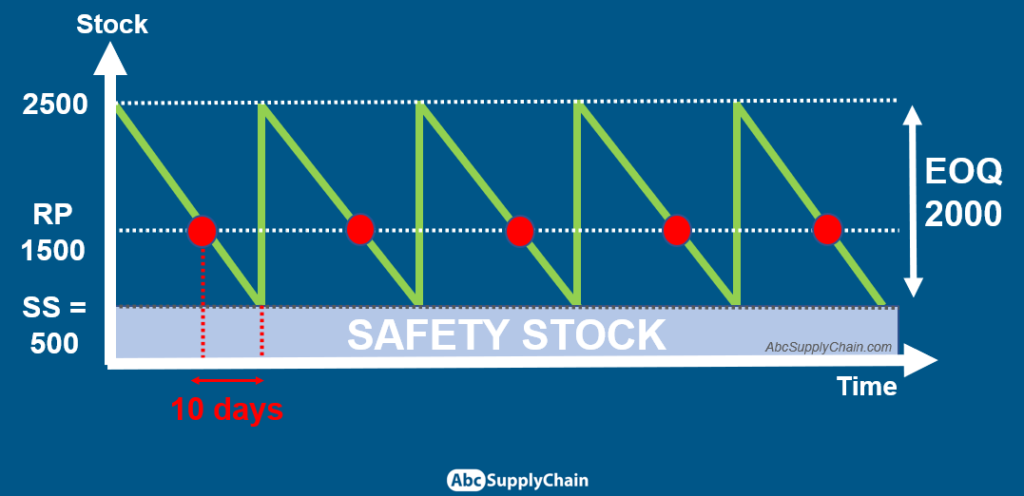
- When there are 1500 remaining quantities, you order 2000 pieces
- During the 10-day transit time, you consume 1000 pieces, which brings your stock level down to 500.
- You receive the pieces ordered, and your stock level suddenly reaches the maximum quantity of 2500.
Nevertheless, this calculation method is extremely basic: it does not have any logic and is rather used “from experience”.
If you use it, I advise you to at least combine it with an ABC classification.
Method 1: formula for calculating safety stock with Average – Max
We can also estimate the Safety Stock by looking at the past variations of both lead times and sales. We make the assumption that what happened in the past will repeat itself: if we protect against the most extreme case (the highest supply variation combined with the highest demand variation) then we are “sure” to cover any future risk.
This is the average – max method that I also call the “prudent father” method.
Safety Stock formula:
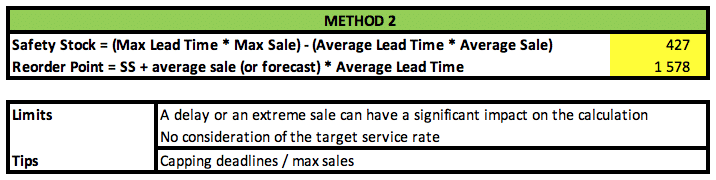
SS = (Max Lead Time × Max Sale) – (Average Lead time × Average Sale)
Safety Stock Calculations:
Here is an example in Excel of the average – max formula. Make sure to always use the same time unit for lead time and demand. Here we use days units.
- We have 12,000 sales quantity over 12 months. This is an average sale of 33 pieces per day.
- The maximum monthly sales quantity is 1200. This is an average of 39.5 pieces per day.
- Over 12 months, we had 10 deliveries. The average lead time was 35 days, and the maximum lead time was 40 days.
Applying the formula, we have a Safety Stock of 427 pieces.
For the Reorder point, the formula remains the same as the previous example:
Reorder Point = Safety Stock + Average Sale (or Average Forecast) x Average Lead Time. Here we have a Reorder point of 1578 units.
This method has the advantage to be very simple to implement. But there are many downsides.
First, you must consider outliers values: if you have an extreme lead times or sale value once in your past data, this will give you very high safety stock.
For example, let’s say your supplier had an exceptional issue, and one of your shipments had very high lead times. You don’t want to use this value in the calculation, as it doesn’t reflect your “regular business”: you don’t want to cover such high uncertainty.
Then, even if you exclude outliers, you will always cover the most extreme case: it means you will have high stock levels the whole year, and thus high inventory costs. Remember that the goal is to balance inventory costs and customer service rate. A trick here is to arbitrarily “cap” the maximum lead time or sales by a percentage, to get a lower safety stock level. You can set higher or lower percentage per product according to the service rate you want, but it is completely arbitrary. I will address in the following methods how to better integrate the service rate into your calculations.
4 Safety Stocks Methods with the normal distribution
To fully understand this method, you can download the Safety Stock calculator (Excel template) HERE.
The following method assumes a normal distribution of demand (also called the King’s method). The normal distribution is a probability distribution symmetric to the mean. The further data is from the mean, the lower the probability of occurrence is.
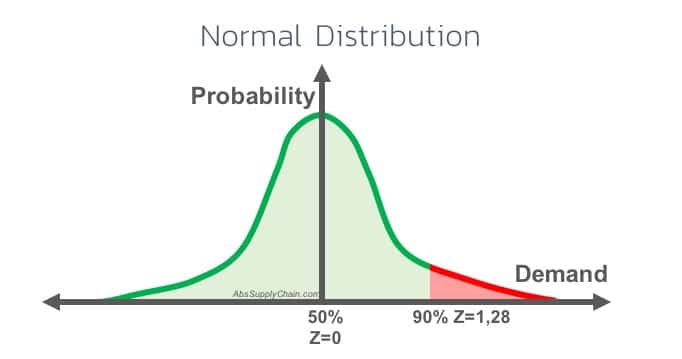
For example, let’s say you sell an average of 1000 pieces per month, and we assume the demand is normally distributed. Each month, you have a high probability of selling close to 1000 pieces, and you have a much lower probability of selling around 500 or 2000 pieces.
Because the distribution is symmetrical, you are as likely to sell less than 1000 next month as you are to sell more than 1000 next month. Also, there is a relation between the level of service (the “acceptable number” of shortages) and the X-axis of the distribution curve: this is the coefficient of service or service factor Z.
Let’s say you want an average service rate of 50%: it means you plan to have enough stock to fulfill your customer satisfaction 50% of the time. Then you don’t need safety stock (Z=0) because, the next month, there is a 50/50 chance of selling more or less than the average.
A service rate of 100% (you never have shortages) is impossible because you would need infinite stock.
For other Z values, we have this lookup table:
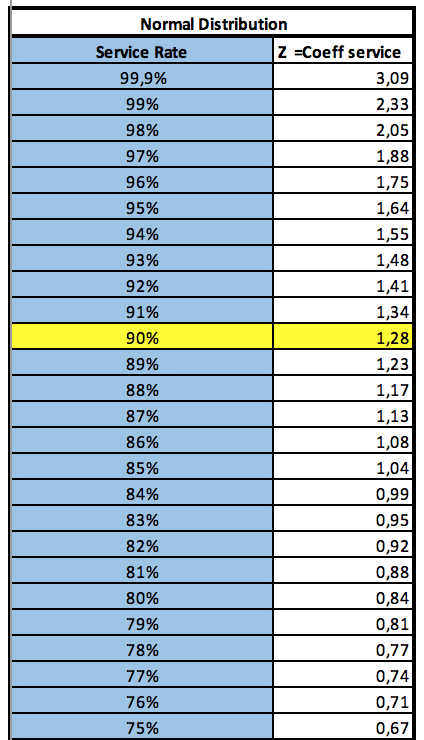
In the next examples, we use a 90% service rate target, so the service coefficient is 1.28.
Safety Stock Method 3: Normal Distribution with uncertainty about the demand
We will go through 4 different formulas using the normal distribution.
In the first case, we will only consider uncertainty about the demand. This is the most used method.
Contrary to the previous examples, we chose here to use time units in months. You could also do it in days, as long as you use the same time units for all the variables (otherwise, the whole calculation is wrong).
We have the following monthly sales data:
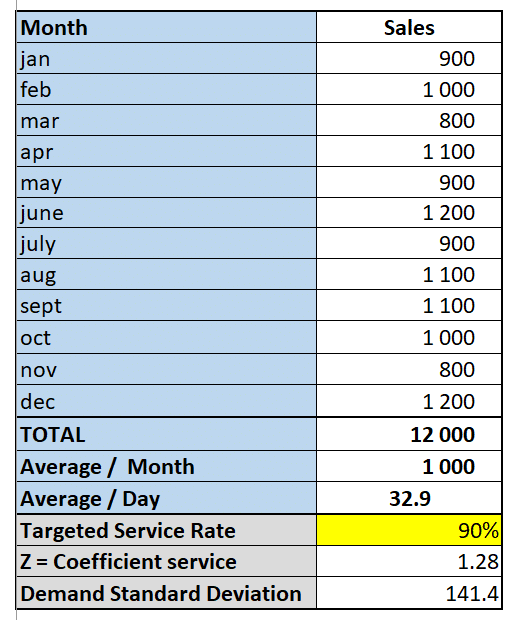
By directly using the demand standard variation formula in Excel, we get a demand standard deviation of 141.4 pieces per month. The average lead time is 1.15 months.
To get the safety stock quantity, we need to multiply the service factor Z by the demand standard deviation σ and the square root of the lead time L.
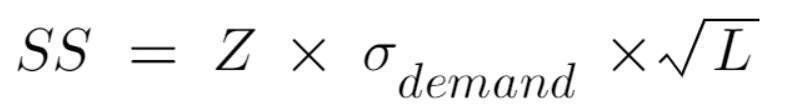
Safety Stock Calculations:
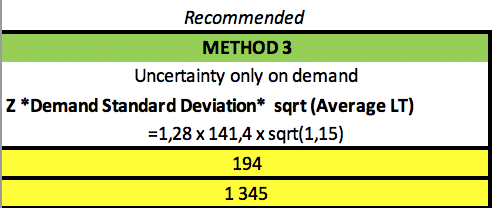
We get a Safety Stock level of 194 pieces. Applying the same formula as the previous examples, we have a reorder point of 1345 pieces.
I recommend using this method if:
- The lead time is quite stable and variations are negligible compared to the demand uncertainty.
- You have almost no visibility over the past lead time data: obviously, you need to work on your data and fix the root cause of this lack of visibility. But you should still start to estimate your Safety Stock levels without considering supply uncertainty: don’t wait to have all the information available to make decisions. You will improve your data and calculations step-by-step.
Safety Stock Method 4: Normal distribution with uncertainty about the lead time
In the second method, we consider uncertainty only about the lead time.
So we need to estimate the lead time standard deviation.
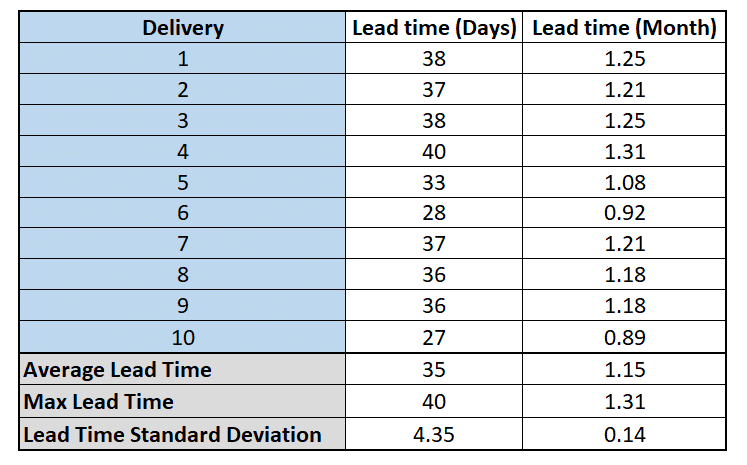
Here we have a Lead Time standard deviation of 0.14 months.
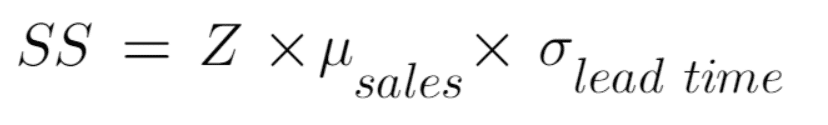
To get the safety stock quantity, we need to multiply the service factor Z by the lead time standard deviation σ and the average demand μ (here, the average demand is the average sale. It would be different if we used a forecast demand).
Safety Stock Calculation:
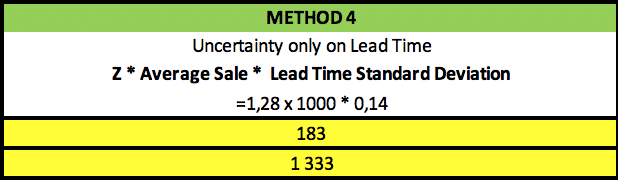
We get a lower safety stock value (and so a lower Reorder Point value) than in the previous case because in this example the lead time variation is rather small.
This method can be used if the demand uncertainty is negligible compared to the lead time variation. In practice, supply chain professionals rarely face this situation. Even if the demand is very steady, it is still advisable to estimate the standard deviation. This is why I don’t particularly recommend this method.
Safety Stock Method 5: Normal distribution with uncertainty about the demand and the lead time (independent)
In the third method, we consider both lead time and demand uncertainty, assuming they are independent, i.e: a variation in lead time doesn’t imply a variation in demand and vice-versa.
Here is the full formula:
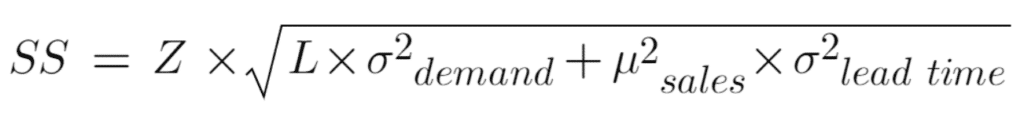
Safety Stock Calculation:
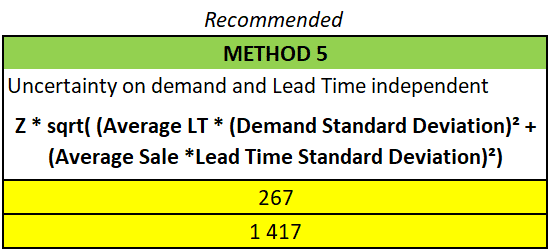
We end up with 267 quantities of safety stock. We have higher values because we take into account both uncertainties.
I recommend this method if you have a clear view of lead time and demand variations.
Safety Stock Method 6: Normal distribution with uncertainty about the demand and the lead time (dependent)
The last method considers both lead time and demand uncertainty, assuming they are dependent, i.e: a variation in lead time can imply a variation in demand and vice-versa.
We have the following formula (it is the sum of method 3 and 4):

Safety Stock Calculation:
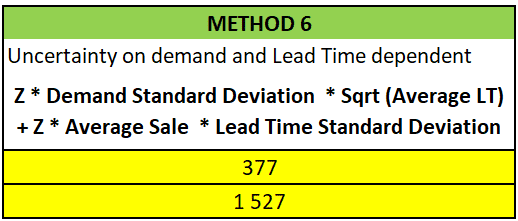
This is the sum of methods 3 and 4. As variations are correlated, we need even more safety stock than the previous method.
An example of lead time and demand dependence is where there is global high demand, driving up supply delays. But you will rarely face such cases, that’s why I don’t recommend this method.
Limits of the normal distribution for your safety stock (or buffer stock):
Whatever the method used, there are limitations:
- Your target service rate is not your real service rate. The service rate we optimize using the formula is the frequency of stock out during the replenishment cycle ( also known as cycle service rate). Whereas, what companies measure (OTIF or Fill Rate KPIs) is the total percentage of stock outs over a period.
- It works poorly with low sales volume.
- It doesn’t consider any seasonality of your supply chain (if you have a forecast demand system that takes into account the seasonality, you can use it with the corresponding deviation).
- There is an underestimation of extreme cases. In practice, the demand profile varies around an average value, with few high sales in the year. The distribution of demand is thus rarely symmetric, the curve is rather “widened to the right”. The same goes for the lead time: your supplier will be sometimes early, sometimes late, and sometimes very late (and never very early).
- The lack of trust caused by the previous issues can incite practitioners to increase service rate parameters manually (we get back to this idea of the Safety Stocks being the “trick” to hide problems).
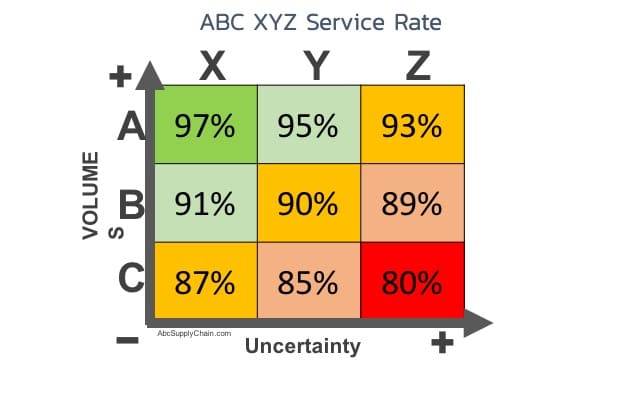
I recommend using a service rate target based on a classification. See my ABC XYZ article here.
Other ways to compute your Safety Stock
There are still other methods for calculating the safety stock, that can solve the problem of demand and lead time that are not normally distributed:
- Binomial Distribution
- Gamma Distribution
- Poisson Distribution
- McKinsey Method
- etc …
If you already have a good understanding of Safety Stock, Reorder calculations and statistics, you can add a bit more complexity by trying those methods. Otherwise, I suggest you to stick with the methods presented above.
The future of Inventory Management: Machine Learning
Some companies already started to use AI & Machine Learning for Inventory Management optimization.
You can choose this path if you already have a dedicated data science team in your company, you have enough budget for AI consulting services, or if you are a data scientist yourself.
I recommend mastering the foundations first to fully understand Inventory Management challenges before trying such advanced techniques.

How to choose the right formula for your Safety Stock?
Keep in mind that data quality is more important than the method.
Here are a few tips for choosing a method:
- You have low volumes: try the average min/max method
- You have higher volumes: use the normal distribution method. Try method 3 or 5 first, depending on your data.
- You don’t have any data about lead time (or unreliable data): this is common. You can still use the method 3.
- Track your performance and adjust (see next the Action Plan I recommend).
5 Key takeaways about Safety Stock Calculation
Why is safety stock important in inventory management?
Safety stock acts as a buffer to prevent stockouts caused by unforeseen fluctuations in demand or supply delays. By maintaining an appropriate level of safety stock, businesses can ensure smoother operations and higher customer satisfaction.
What factors contribute to the need for safety stock?
The primary factors include:
- Demand Uncertainty: Variability in customer demand can lead to unexpected shortages if not properly accounted for.
- Lead Time Uncertainty: Delays in replenishment due to factors like production issues or transportation hold-ups can disrupt inventory levels.
How is the basic safety stock calculated?
A straightforward method is:
Safety Stock = Average Sales × Safety Days
For instance, if daily sales average 100 units and you want to cover 5 days as a precaution, the safety stock would be 500 units.
What is the Average-Max method for determining safety stock?
This method considers historical data:
Safety Stock = (Maximum Lead Time × Maximum Sales) – (Average Lead Time × Average Sales)
By analyzing past variations in lead times and sales, this approach aims to cover extreme cases of demand and supply fluctuations.
Are there advanced methods for calculating safety stock?
Yes, statistical approaches using normal distribution can be employed, especially when accounting for uncertainties in demand and lead time. These methods provide a more tailored safety stock level based on desired service levels and variability metrics.
Safety Stock: your Action Plan
- Download the Safety Stock Calculator (Excel Template)
- Choose the right method
- Compare with your current values
- Identify and adjust products with major deviations
- Automate
- Track Performance
- Optimize
Other Inventory Management content
I recommend you to check out our videos tutorial :
- ABC XYZ Analysis to define your target service rate (Excel Tutorial)
- EOQ Formula to optimize your economic order quantity (Excel tutorial)
- 11 solutions to optimize your inventory & shortage
Become an Inventory Management Expert
In today’s fast-paced and uncertain business environment, managing inventory efficiently has never been more critical. Balancing between the risk of stockouts and the cost of overstocking can often feel like walking a tightrope. That’s why we’re thrilled to invite you to our complimentary Inventory Management Workshop titled “How to Avoid Shortages and Overstocks in Times of Great Uncertainty”.

This workshop is more than just a theoretical exercise. We are offering hands-on insights into practical strategies that you can apply to your business right away. Here’s a glimpse into what the workshop holds in store for you:
– Mastering Sales and Supplier Uncertainty:
Dealing with uncertainty can be challenging. I will share my proven method for managing this uncertainty, outlining 13 critical parameters you need to master. This will empower you to anticipate changes in demand or supply and make informed decisions accordingly.
– Optimize Inventory and Improve Service Rate:
Discover how to reduce your inventory levels without compromising your service rate. Learn simple and effective techniques to increase operational efficiency and customer satisfaction.
– Live Case Studies and Excel Tools:
Get access to practical tools and learn from real-world examples. We’ll walk you through Excel files and discuss case studies from industry giants such as Zara, H&M, and Amazon. Understand how these leading companies optimize their inventory management, and gain insights that can be applied to your own business.
My workshop promises an enriching learning experience that equips you with the knowledge and tools to navigate the challenges of inventory management in uncertain times. Whether you’re a seasoned professional looking to upgrade your skills or a novice seeking to understand the fundamentals, this workshop has something valuable for everyone.
Join us in this journey of learning and transformation. Sign up for our free Inventory Management Workshop today and take a significant step towards mastering inventory management in your organization. Don’t miss this opportunity to learn from the best and supercharge your inventory management strategy!