The forecast reliability or forecast accuracy is a key indicator in demand planning. If chosen correctly and measured properly, it will allow you to reduce your stock-outs, increase your service rate and reduce the cost of your Supply Chain. This 5 steps guide covers calculating accuracy metrics such as MAPE, MAE, and RMSE, with Excel templates for quick application and easy implementation of the right KPI in your business
Watch below my Forecast accuracy step-by-step tutorial in Excel:
You can download the Forecast Accuracy Calculator used in this article here:

There are many methods to gauge the quality of sales forecasts. I studied them a lot: I surrounded myself with experts, read reference books and compared them to my own experiences in sales forecasting. I came to the conclusion that THE perfect method does not exist and that the many existing solutions are like a maze of mathematical formulas. Sorting through them can be difficult.
That’s why the best thing for you to do is to choose a consistent method that’s easy to implement and maintain, and that allows you to estimate the quality of your sales forecasts at a glance.
I’ll walk you through step-by-step on how to do this, from selecting the parameters to the details of the calculation.
Table of Contents
1) First… have a demand forecasting
The first step is… to have a demand or sales forecast. You may smile, but many companies don’t have one. If you don’t have one, simply start with this calculation: average sales X seasonality X growth. If you have an ERP or other software, you probably already have forecasts that might include external factors and raw materials.
Sales forecasting is a very broad topic, and I won’t go into it any further in this article. If you have a specific need in this area, my “Forecasting Expert” program (still in the works) will provide the best forecasting accuracy models for your entire supply chain and inventory management.
If you really can’t wait, you can have a look at my article: Forecasting in Excel in 3 Clicks: Complete Tutorial with Examples, where I provide easy methods to forecast in Excel in less than 5 minutes.
2) Define a demand forecast horizon
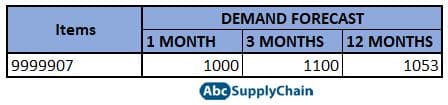
Once you have your forecasts properly implemented, you need to define a forecast horizon. This is simply the length of time into the future for which forecasts are to be prepared.
In the following example, a sales forecast was calculated at the item level for the month of May. These forecasts are updated each month and take into account the order history: in January, the forecast for May indicated sales of 500 quantities. In February, it was 700. In March, it was 900, etc. Finally, 1,000 quantities were sold.
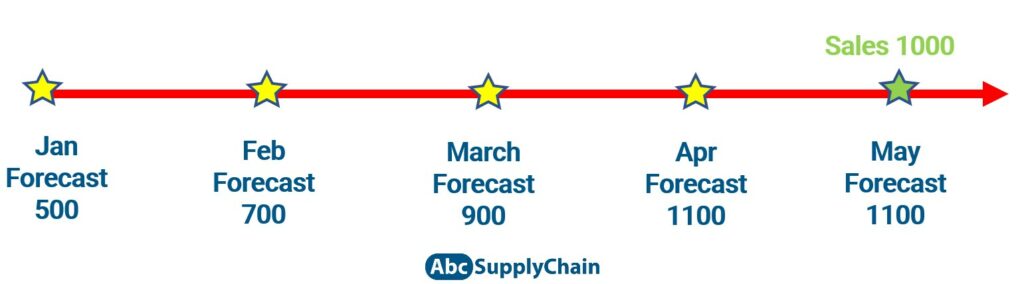
It becomes obvious that the Forecast Accuracy computation will not be the same if we choose a one-month horizon (April forecasts) or a four-month horizon (January forecasts).
So, how do you correctly choose the forecast horizon?
Ideal solution: the average supply lead time of the item
Let’s assume you have a 90-day supply lead time for a specific item. To order May quantities, you should base your order on the forecast made in February.
So ideally, you should choose a 90-day horizon in your forecast accuracy computation: the reason is that after February, you could not react anymore.
The problem is that procurement lead times are very often item or supplier-specific. So you would end up with item-specific horizons, and item-specific forecast accuracy KPIs. Extending these calculation rules across your entire product portfolio would quickly become very complicated, which is the big disadvantage of this method. And there is a risk your colleagues could not keep up with you, due to this complexity.
To be transparent with you, while this method is ideal, I have rarely seen it used. Even within large corporations.
Recommended solution: the general supply lead time
If you want to keep it simple, I recommend using an average time to supply. If your average supply time is 2 months, compare your sales with your forecast made 2 months before. If you are in a very short-term business like manufacturing, go with a forecast horizon of one to two weeks.
Keep the same rule for all your products.
If you have no idea what time frame to take, simply use the previous month. While this may seem to be too short to react, it is still worthwhile as it is a simple way to take action in creating your KPI.
3) Save your demand forecast history
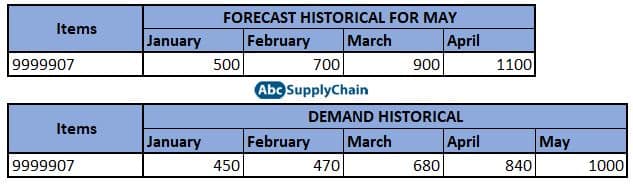
To be able to perform the calculations, you need to have access to two sets of data: the forecast history and the demand forecasting accuracy history.
So start recording historical data by article. And if possible, by week.
If you don’t want this to be too difficult to maintain for your inventory management, I really recommend creating a single table or database that centralizes all this data. If you do it by hand, only keep the data from the previous month.
Please pay attention to the following:
- Be sure to use actual demand, not sales. For example, if you are asked for 1,000 pieces and only sell 500 because of a stock out, the forecast accuracy calculation should assume a demand of 1,000, not 500.
- Save your quantity and value data (I recommend sale price, but purchase price may also be appropriate). For example, if you sell screws and motors, the screws are certainly much less important than the motors in terms of margin. So it’s important to value them to give them weight in the calculation.

- Finally, I would advise you to have the history of active/inactive items, as some companies calculate their forecast accuracy only on active items.
4) Choose a forecast accuracy calculation method
Once you have determined the history and forecast horizon, you can get started on the forecast accuracy calculation.
The following examples use a Forecast Accuracy Calculator that you can download here:
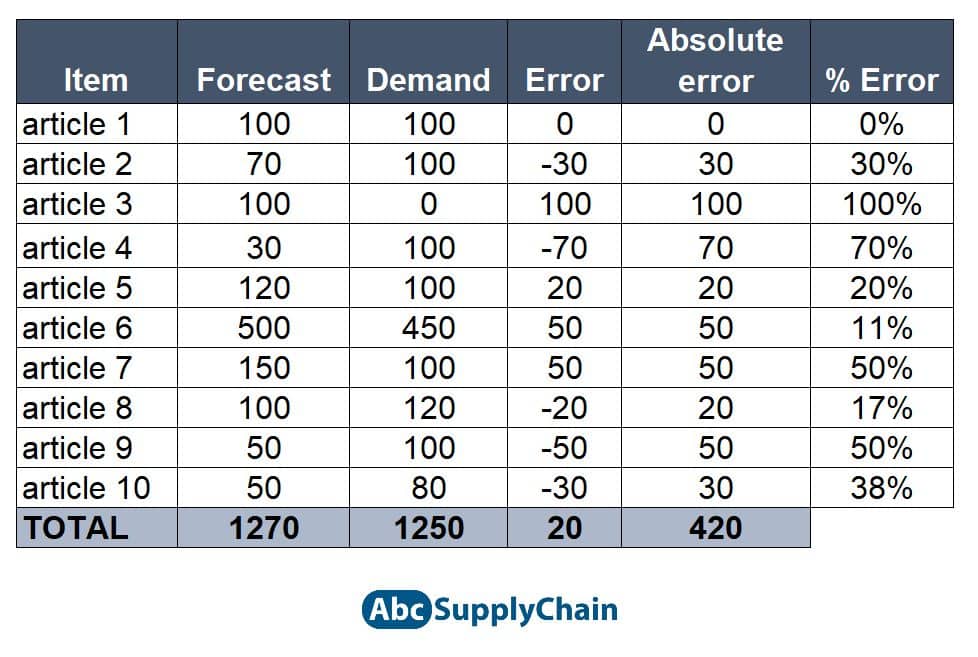
- The first step is to calculate the forecast error at the item level. Simply subtract the forecast from the demand for each item.
- The next step is to retrieve the absolute value of the error calculated earlier (use the =ABS() formula in Excel).
- Finally, you need to calculate the % of the error, again at the item level. Simply divide the absolute value of the error by the demand, and multiply it by 100.
Here is the Excel result of these 3 calculations for a 2-month horizon:
Now that you have the errors by article, the question is how to tally all of these errors, to get an overall indicator.
There are many ways to get this global indicator. Here, I’ll introduce you to the 4 most commonly used mathematical formulas. This is going to be kept very simple.
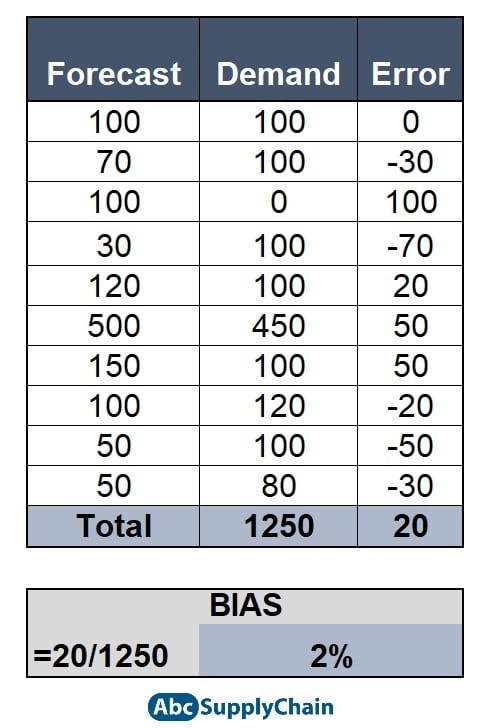
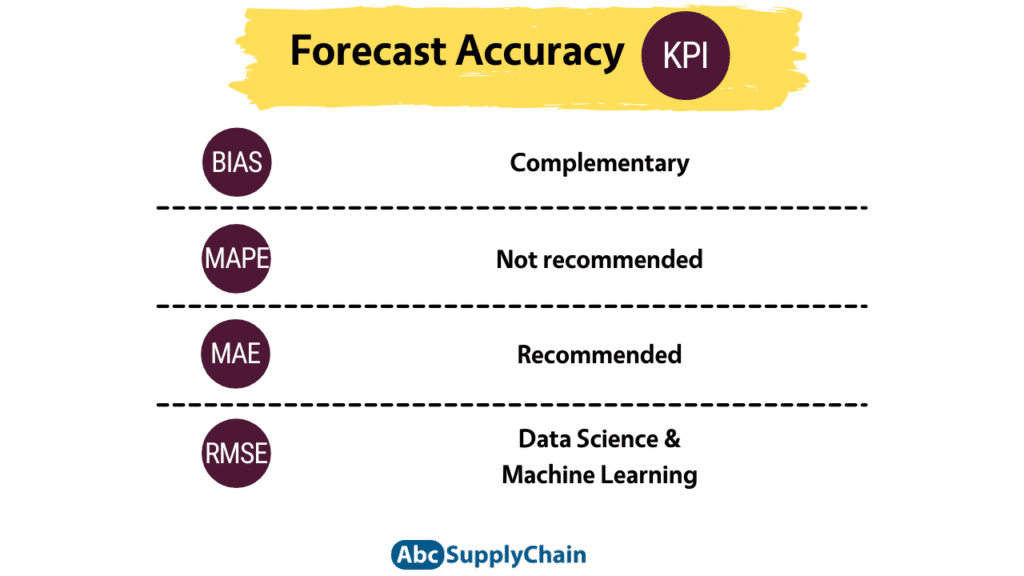
1- BIAS forecast accuracy (consistent forecast error)
Prediction bias is the systematic deviation between estimated and actual values. It is useful to see if you tend to overestimate (BIAS > 0) or underestimate your predictions (BIAS < 0) for all your items. I suggest you take a look at this small article from the University of Arizona that illustrates the difference between accuracy, precision, and bias.
The forecast accuracy formula is straightforward : just divide the sum of your errors by the total demand.
2-MAPE forecast accuracy (Mean Absolute Percentage Error)
MAPE is the average percentage of error. The forecast accuracy formula is simply the average of the error percentages:
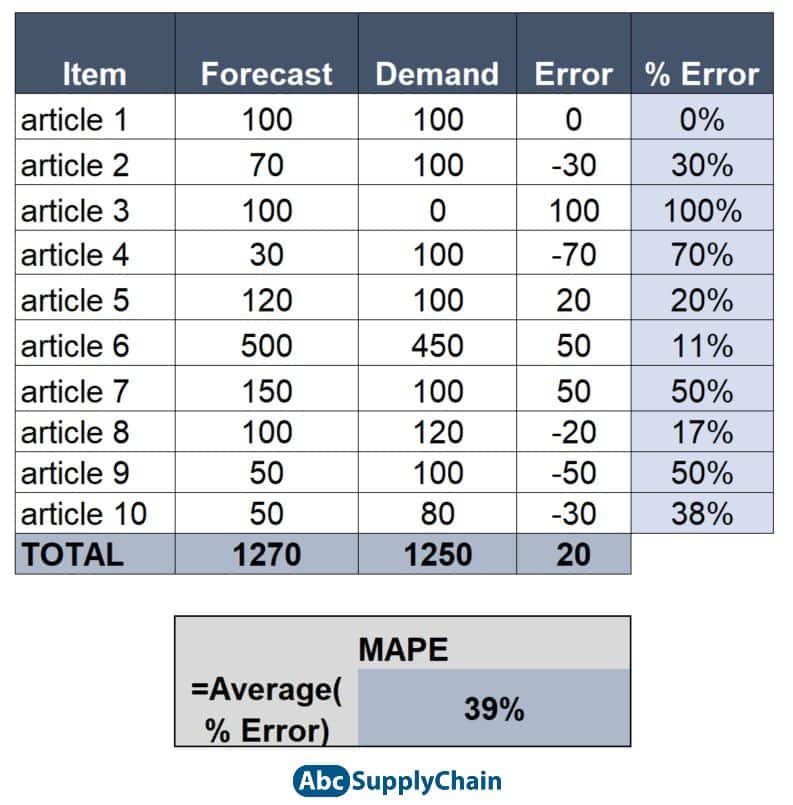
This method is really not recommended, because there is no weighting, neither on quantities nor on values. If you rely on this indicator to optimize your long term forecasts, you will tend to underestimate periods of high demand. I recommend this method only in the context of an ABC classification for your demand forecasting.
3- MAE forecast accuracy (Mean Absolute Error)
MAE, also known as MAD (Mean Absolute Deviation) or WAPE (Weighted Absolute Percentage Error), is the calculation of the average of weighted absolute errors. It involves dividing your total absolute errors by the total demand.
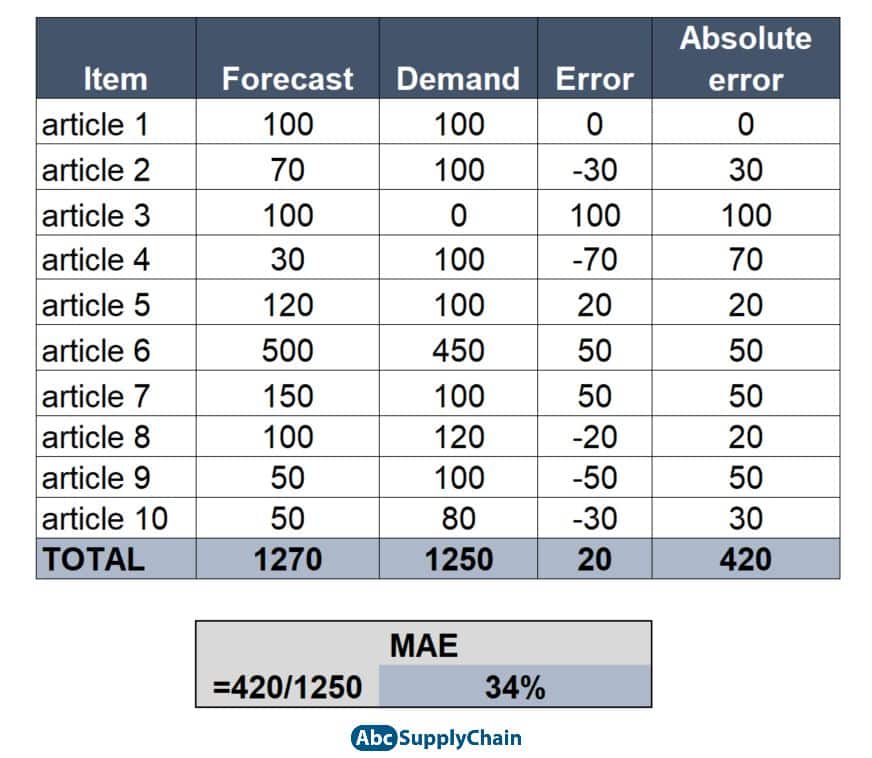
This is for me the recommended method in demand planning, it is simple to explain and is weighted by quantity or value (I always recommend weighting by value and not by quantity).
4- RMSE forecast accuracy (Root Mean Squared Error)
The RMSE is calculated from the MSE (Mean Squared Error, or MSD for Mean Squared Deviation).
The MSE is the average squared error per article. Compared to the previous indicators, we need to add the squared errors per article.
Then we can get the RMSE which is the square root of the MSE.
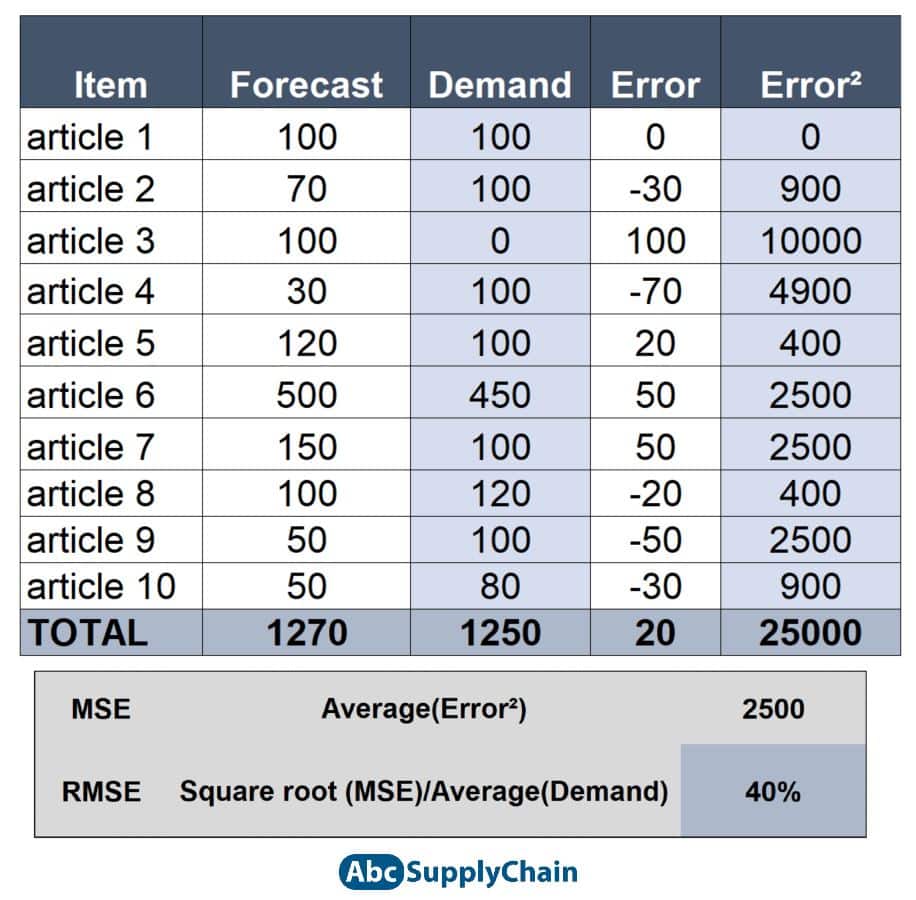
The RMSE is much more complex to explain and understand. The advantage of this formula is that it strongly penalizes large forecast errors.
I only recommend these 2 indicators for people who are already comfortable with statistics and data analysis (even in data science and machine learning algorithms), as they will be better able to avoid computation errors, interpret results correctly, and most importantly, communicate with decision makers.
5) Calculation of the Forecast Accuracy KPI
I therefore recommend you to use the MAE to calculate your KPI, it is simple to implement and interpret. It facilitates performance tracking and allows for effective communication with your colleagues in sales forecasting. You can use the bias as a complement, to detect recurrent errors you won’t notice with MAE alone.
Then, the KPI is derived from the overall % error we just calculated. It doesn’t matter which formula is chosen.
The accuracy KPI is simply calculated as 1 – % Total Error (MAE, RMSE etc.). For example, if your MAE is 20%, then you have a 20% error rate and 80% forecast accuracy.
Using the accuracy as a KPI rather than using the error is somehow a more positive way to communicate for your demande forecasting.
Conclusion
Estimating future sales is critical to your business, so it’s crucial to measure the reliability of those estimates.
By taking it step by step, I’m sure creating a forecast accuracy indicator will be a breeze for you. If you don’t have access to historical data or don’t have any forecast yet, don’t be discouraged and just start, as explained in this article.
You can download the Forecast Accuracy Calculator used in this article here:
5 things to remember
What is forecast accuracy in demand planning and why is it important?
Forecast accuracy measures how closely your demand forecasts align with actual sales. High accuracy is crucial as it helps reduce stock-outs, improve service rates, and lower supply chain costs.
What are common methods to calculate forecast accuracy?
Key methods include:
- BIAS: Indicates consistent overestimation or underestimation in forecasts.
- MAPE (Mean Absolute Percentage Error): Shows the average percentage error between forecasts and actual sales.
- MAE (Mean Absolute Error): Represents the average magnitude of errors in units.
- RMSE (Root Mean Squared Error): Calculates the square root of the average squared differences between forecasted and actual values.
How can I calculate forecast accuracy using Excel?
Why is it necessary to save historical forecast data?
Retaining historical forecasts allows for the evaluation of forecasting methods over time, helping to identify patterns, assess accuracy, and make necessary adjustments to improve future forecasts.
How does forecast accuracy impact inventory management?
Accurate forecasts enable better alignment of inventory levels with anticipated demand, reducing the risk of overstocking or stock-outs, and leading to more efficient supply chain operations.
Go further
If you want to develop your skills on similar topic, you can also check my articles: