ABC analysis is a method used in inventory management to categorize items into three groups—A, B, and C—based on their importance and consumption value.
- A items: High-value items requiring tight control and accurate records.
- B items: Moderately important items with less controls.
- C items: Low-value items with the simplest controls and minimal records.
By mastering ABC analysis, you can enhance your inventory management practices, reduce holding costs, and boost overall profitability. In this comprehensive guide, I will provide you with a step-by-step tutorial on implementing ABC analysis, using Excel.
I used this Excel Template to perform the analysis.

Many people think you have to be a Data specialist to be able to analyze your supply chain and improve your inventory management. There are indeed very advanced methods that require particular expertise. It is costly, but if it is implemented in the correct context with sufficient resources, it can pay off.
But most of the time, it is not needed. It might even be counter-productive: I see many people seeking complexity before mastering the foundations.
There are many very simple and affordable ways to better manage stocks, and some remain little used despite their proven effectiveness. One of them is the ABC Analysis.
Pareto Principle
“80% of the results are produced by 20% of the causes“

- 20% of the population owns 80% of the wealth.
- You spend 80% of your time with 20% of your friends.
- 20% of your customers represent 80% of your turnover.
- 20% of your suppliers represent 80% of your purchases.
- 20% of your products represent 80% of your turnover.
- 20% of your products represent 80% of your stock.
So the Pareto’s law is simply about focusing on what really matters to get the best results. In Inventory Management, It is about classifying the few items that will make the most of your business (A products), and the many items that makes a small part of your business (C products). B products are in-between.
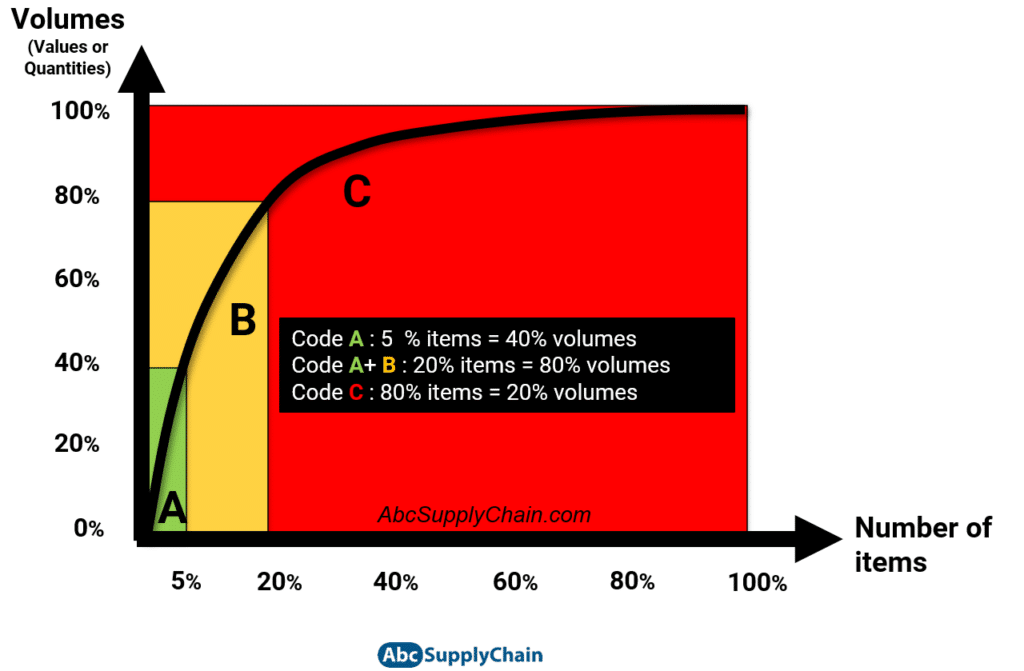
Pareto Curve – ABC Analysis example in the fashion industry
We can apply the ABC logic for both past and forecasted sold volumes, either in Values or Quantities.
Here is the curve we get, with 5% of items being A codes and 80% being C codes:
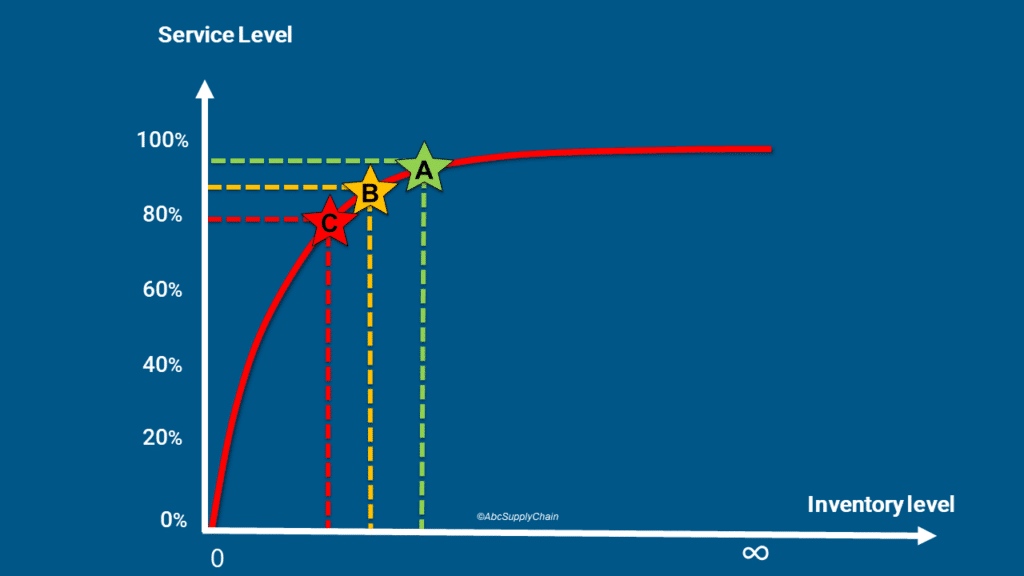
The idea is to target different service level according to the product classification, which will dramatically impact your Inventory Management strategy and your cash flow. For items that are the major drivers of your business, you might seek nearly 100% of service level to maximize sales benefits and customer satisfaction. For C codes, you may seek a much lower service level, to lower your stock on a wide range of products.
Let’s look at a practical example.
Let’s say you work in the fashion industry. You have 3 types of tee shirts in your product portfolio: one is black, another is orange, and the last one has original patterns. You want to manage your stock according to a specific product prioritization.
The black tee shirt is a top seller, thus an A code. Your B item is the orange shirt as it is less sold. Only few people with specific buying criteria will get the last tee shirt: it is your C code.

You will then set different target service levels depending on this ABC classification. In short, you will hold more stock for the black tee shirt to ensure maximum service rate. And you will accept more risk of stock-out for the fancy one, to optimize your inventory turnover levels.
Those service rates will be the input to compute your Safety Stocks, set your reorder strategy etc.

ABC Analysis in Excel: an example in 5 steps
Here is a step-by-step tutorial using my ABC Analysis Template on Excel.
1) Data Gathering from store
In Inventory Management Analysis, one of the most critical part is always to collect data. Luckily, for the ABC classification, you will only need very basic information.
a) Include all your product portfolio
- Active: the items you are currently selling.
- Discontinued: the products that you are no longer ordering/manufacturing. It is important to have a clear view of those products: to estimate the obsolete inventory and to be sure to not reorder them to have a better inventory control
- New Product: the products that you will sell in the future.
b) Quantity or Value classification ?
First, get your sales history and forecasts and classify them by month and references. I highly recommend you to use volume in value rather than in quantity: if you sell millions of plastic bags for your business, they represent a significant quantity but have little or no value.
c) Sales history or sales forecast ? Which period to use ?
Take both past and future values for your classification. For example, I usually select 3 months of historical data and 9 months of forecasted data.
First, it gives a good mix between past and future data. The future data is needed, as you want to manage your Inventory Management System according to what will happen in the midterm. And the past values will mitigate the potential errors of the forecasts.
Then, taking as much as 9 months forecast is a good way to keep an eye on New Products.
If you don’t have any forecasts, you can still add up the last 6 or 12 months.

2) Sort the products
Secondly, we need to sort the products in descending order of 12 months turnover, using a Pivot Table.
It is useful to use a Table format -and not just regular rows and columns- for the sales and forecast data. Thus, we can use the name of the Table in our Pivot Table (in that example it is by default Table2, but you can rename it). That way, you won’t need to edit your Pivot Table when new lines are added in Table2.

- Select The item codes, the item description as Rows, and the 12-month revenues as Values.

- Display your Pivot table in tabular form and delete all totals to obtain a clear and easy-to-read result.
- Click on the additional sorting option and select descending sorting on the 12-month sum.
- Add a ranking column after the sorting, with a simple 1,2,3… sequence.

3) Calculate the cumulative item and turnover percentages
After sorting our portfolio, we need to calculate cumulative percentages of products and revenues.
For each item:
- We divide the Ranking by the total number of Items:

- We add the %Turnover of the item and the cumulative %Turnover of the previous ranked item:

4) Set up the ABC Analysis in Excel
Set up the ABC Analysis codes: In the last column, insert the formula “IF”.
- If the cumulative turnover percentage < 40%, then it is an A code
- If the cumulative turnover percentage > 80%, then it is a C code
- If it is neither of the two, it is a B code.
The details of this formula are explained in the video and can vary according to your data.

For more visibility, you can include conditional formatting colors for every different code.
5) Create your Pareto Curve
To get the graph, select your table, and insert the curve in the insertion tab:
- % of Items as your X axis
- % of Revenues as your Y Axis

Please note that your Excel must be updated at least once a week, especially if you work in procurement. A common mistake is not spending enough time on this ABC classification, which represents a considerable saving of time and money.
Download the Excel ABC Analysis
You can download the Excel ABC Analysis presented above with more than 500 articles on this link.
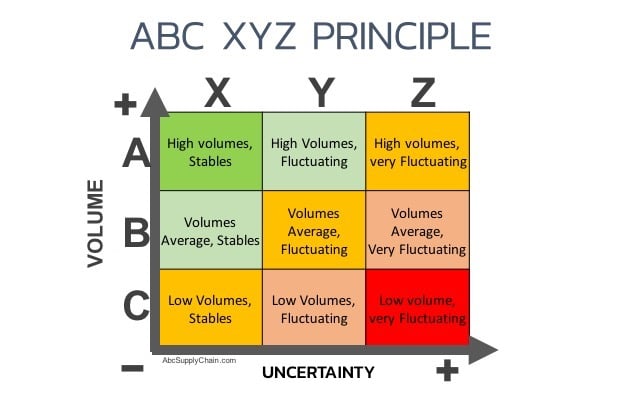
Go Further: ABC XYZ Analysis
One of the disadvantage of the ABC Analysis method is that it does not take into account the volatility of sales or consumption. It is then necessary to use the ABC XYZ classification.
The ABC XYZ classification provides a framework for defining inventory management strategies, by classifying products according to their sales volume (ABC) but also according to their uncertainties (XYZ). Your procurement strategy will then be different according to this new classification to optimize your stock and customer service rate.
You can read our article on the ABC XYZ classification here.
Frequently Asked Questions about ABC Analysis
What is ABC Analysis in inventory management?
ABC Analysis is a technique that categorizes inventory items into three groups—A, B, and C—based on their significance and consumption value. ‘A’ items are high-value products requiring strict control, ‘B’ items are of moderate importance with less stringent controls, and ‘C’ items are low-value with minimal control requirements.
How does the Pareto Principle relate to ABC Analysis?
The Pareto Principle, or the 80/20 rule, suggests that 80% of outcomes result from 20% of causes. In ABC Analysis, this translates to a small percentage of items (‘A’ items) accounting for a large portion of the inventory value, emphasizing the need to focus resources on these critical items.
Can ABC Analysis be performed using Excel?
Yes, ABC Analysis can be effectively conducted using Excel. The process involves gathering data, sorting products, calculating cumulative percentages, setting up the analysis, and creating a Pareto curve to visualize the classification.
What are the benefits of implementing ABC Analysis?
Implementing ABC Analysis helps in prioritizing management efforts, optimizing inventory control, reducing holding costs, and enhancing overall profitability by focusing on the most impactful items.
Is ABC Analysis sufficient for effective inventory management?
While ABC Analysis is valuable, it may not be entirely sufficient. Combining it with XYZ Analysis, which considers demand variability, provides a more comprehensive approach to inventory management.