ABC XYZ analysis is a powerful inventory management tool that combines two methods: ABC classification by value and XYZ analysis by demand variability. This approach helps businesses optimize stock control, balancing high-value items with demand predictability.
In this guide, learn to categorize items, manage demand fluctuations, and leverage Excel templates for effective inventory planning.
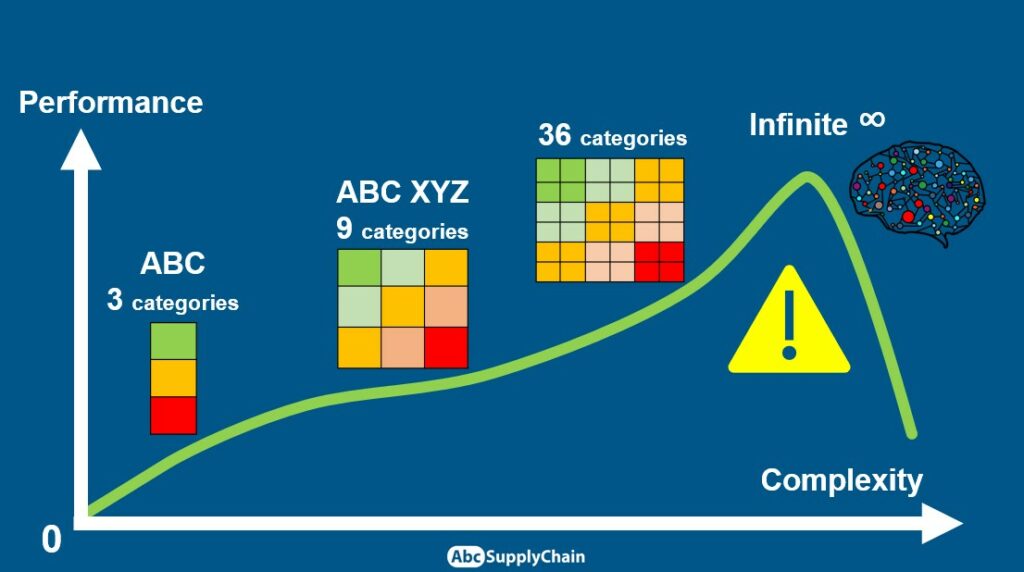
And yes, the ABC classification is a good start, but it might not be enough to manage stock levels correctly. I will tell you why in this article and how to add more categories to the analysis.
ABC XYZ analysis in Excel: Step-by-step video tutorial
To follow my tutorial this method, you can download the ABC XYZ Analysis Excel template here:

The ABC classification is not enough
If you have never heard of the ABC classification, I advise you first to consult our article on the matter. I explain in concrete terms what ABC analysis is with an example to download in Excel.
Briefly, the main advantage of the ABC analysis is to focus your time and energy on the products that represent your biggest sales, but also the most inventory for your company.
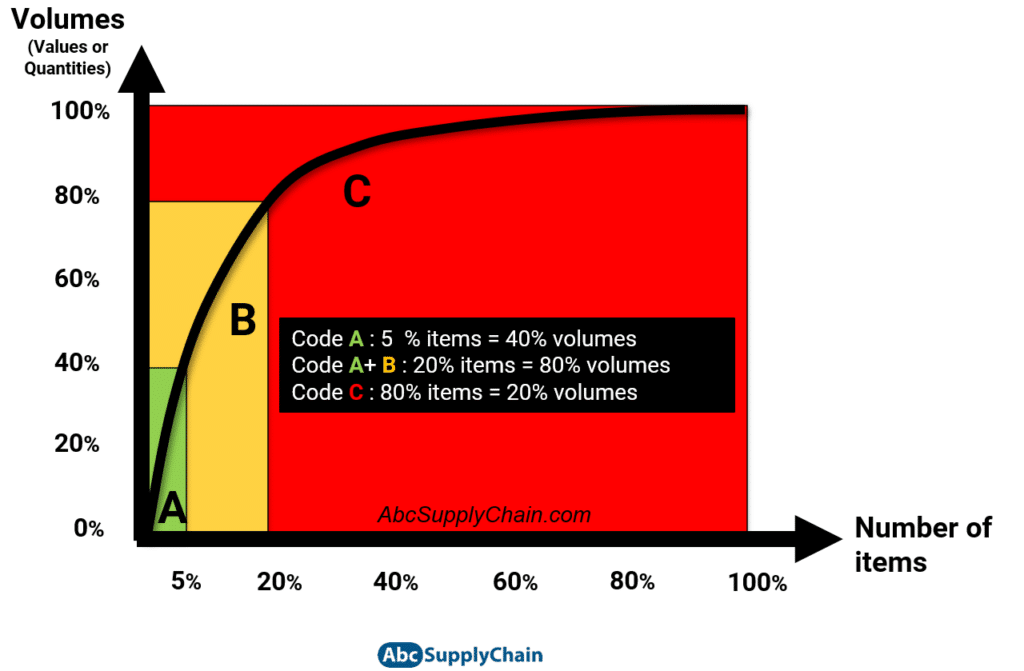
When it comes to inventory management, the ABC Analysis is a good tool to:
- Identify the products we should review and spend most of our time on (demand planning reviews/meetings, emails…)
- Set Service Rate targets, that determine safety stock levels (see my article about Safety Stock here).
About the latter, there are 2 classic mistakes made by companies:
- Setting high Safety stock on A codes, to protect top sellers
- Setting low Safety Stock on A codes, because sales volume is high, so they seem more predictable
We have the opposite issues for C items:
- Setting high safety stock on C codes because these items are unpredictable
- Setting low safety stock on C codes because we don’t want to hedge low selling items
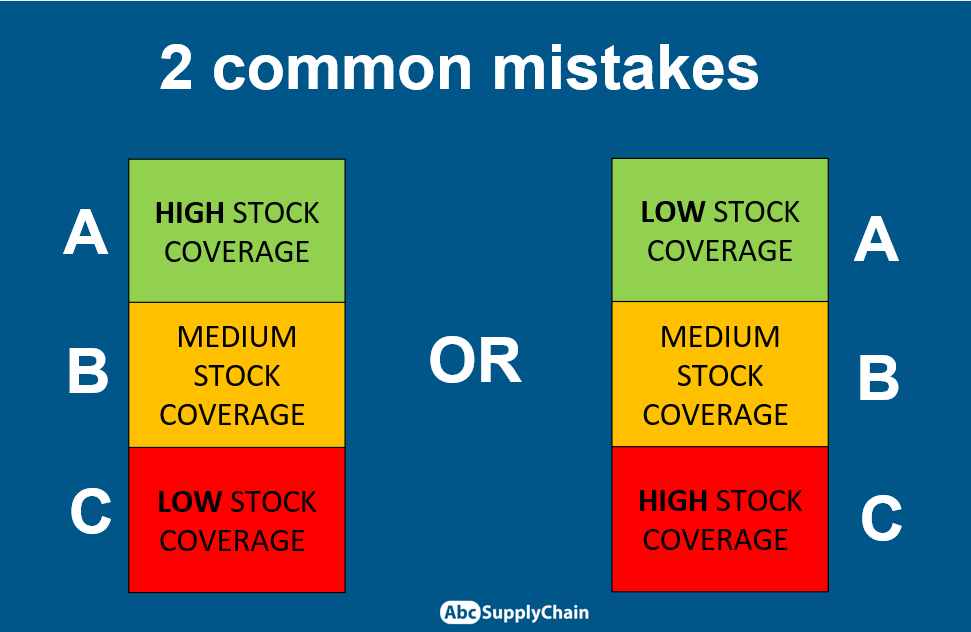
Both statements are incorrect because it all depends on the uncertainty of demand.
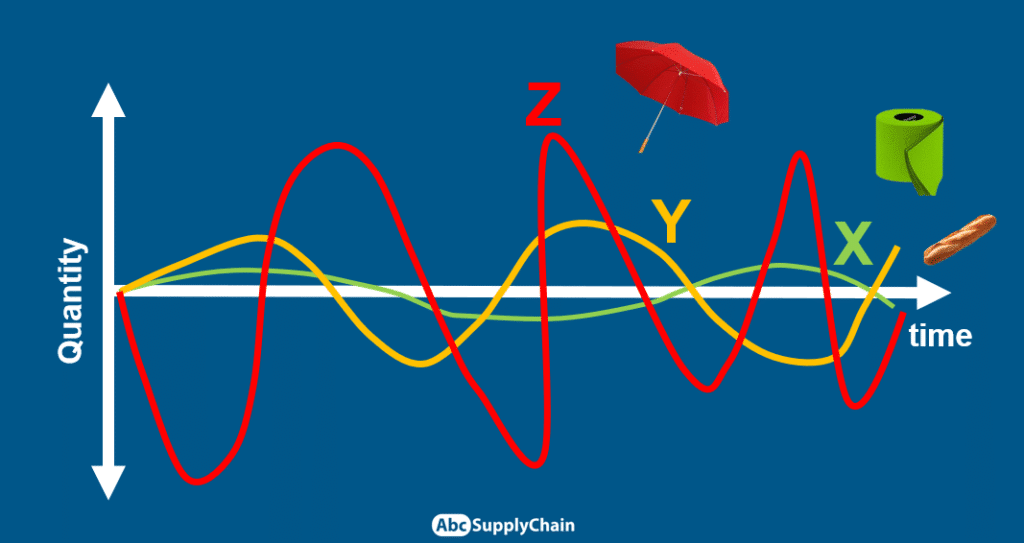
XYZ analysis: demand uncertainty
To better estimate service rates and safety stock targets, we need to add another dimension: XYZ categories.
Products have different levels of demand uncertainty. For example, there are stable products such as toilet paper, and others with much more volatility, such as umbrellas – which are sold only during rainy periods (Z items). You will probably have a better forecast quality on toilet paper (X items) than on the umbrella (Z items). Other products are in-between (let’s say… french baguette, more or less stable during the year with peaks during holidays)
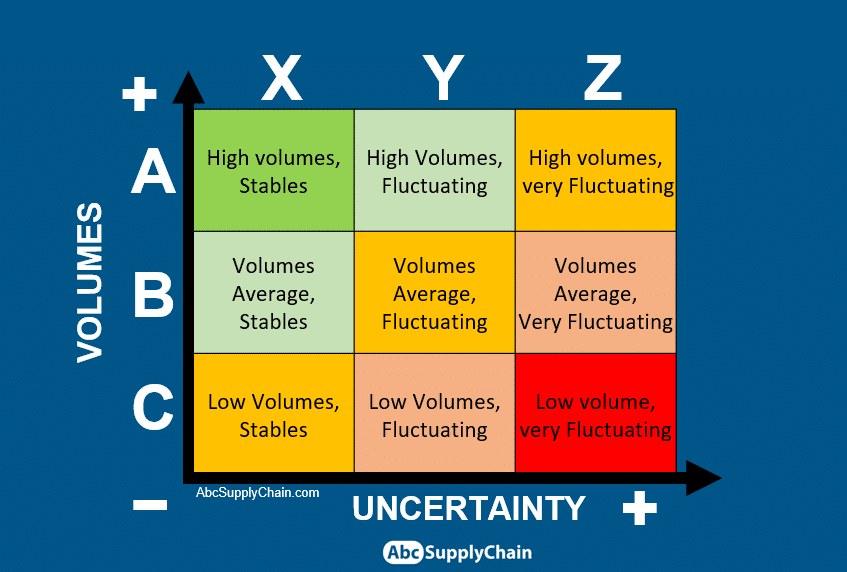
ABC XYZ analysis in Inventory Management
The main idea of the ABC XYZ analysis is to combine ABC and XYZ categories across two dimensions: we end up with a matrix of 9 categories.
Then, we can classify items around 4 extremes:
AX: High sales volumes, stable
AZ: High sales volumes, very volatile
CX: Low sales volumes, stable
CZ: Low sales volumes, very volatile
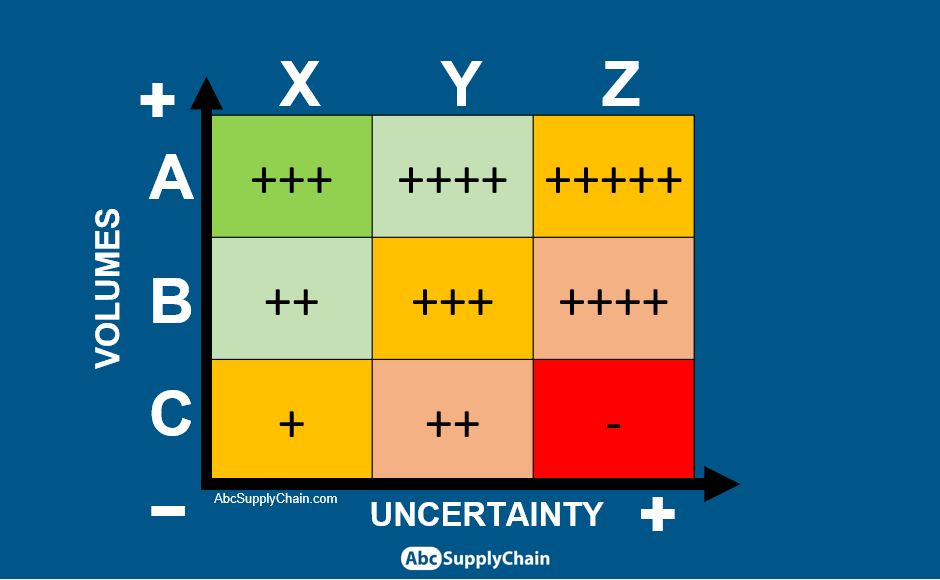
Inventory Management Policy
To use effectively the ABC XYZ matrix, we need to define an Inventory Management Policy: setting service level and safety stock targets. Roughly speaking, if you want a better service level, you need higher safety stock.
For example, we can choose to hold more inventory for the A category, as A items are the major drivers of your business, and we want to maximize the service level for those products. For AX items, we can afford to hold less safety stock than AZ items, as we have better visibility over the demand.
The same logic applies to B items.
Regarding C codes, you can decide to hold low inventory for both CX and CZ categories, for two reasons:
- CX items have a low impact on the business, so we can afford to set a lower service level. Also, they are stable, so we require even less safety stock.
- CZ items are very volatile. We can think we need therefore a bit more safety stock, but I know by experience that most of the time It is not worth it: because they are both low-selling items and very unpredictable, CZ items are often a source of high stock levels and unnecessary headaches. I noticed that CZ items represent a big part of the total sleeping inventory of most companies. It might be wise to set lower service levels for this category.
Here is an example of Service Level targets for the Inventory Management Policy we just defined:
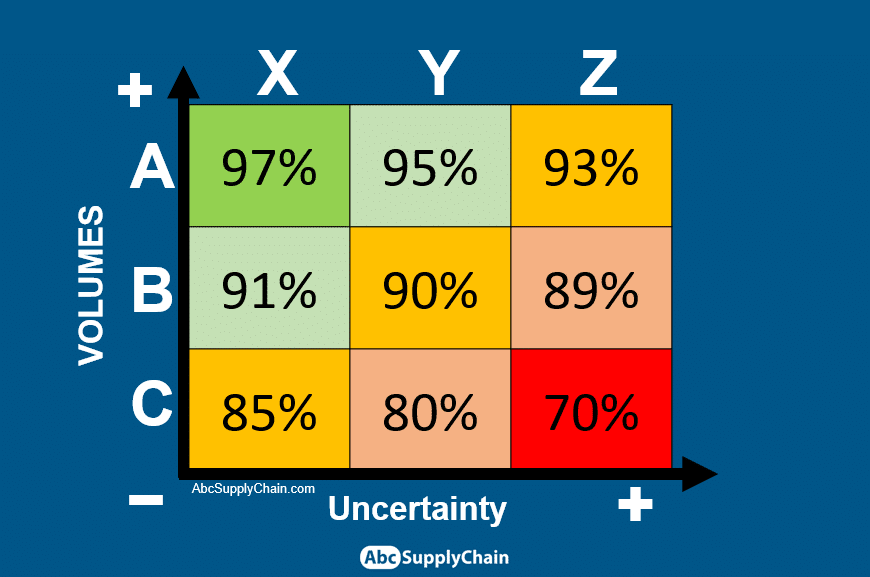
Remember that this is just an example. There is no golden rule, it all depends on your own supply chain challenges. For example, if you want to focus more on the customer service rather than the stock levels, you might want to have a bit higher service rate targets for Z items. The key is always to find the right balance between the inventory and the service level.
ABC XYZ Analysis in Excel
You can download the ABC XYZ Analysis Excel template here:
In this example, we have a list of items with the last 12 months’ sales, already categorized with ABC classification.
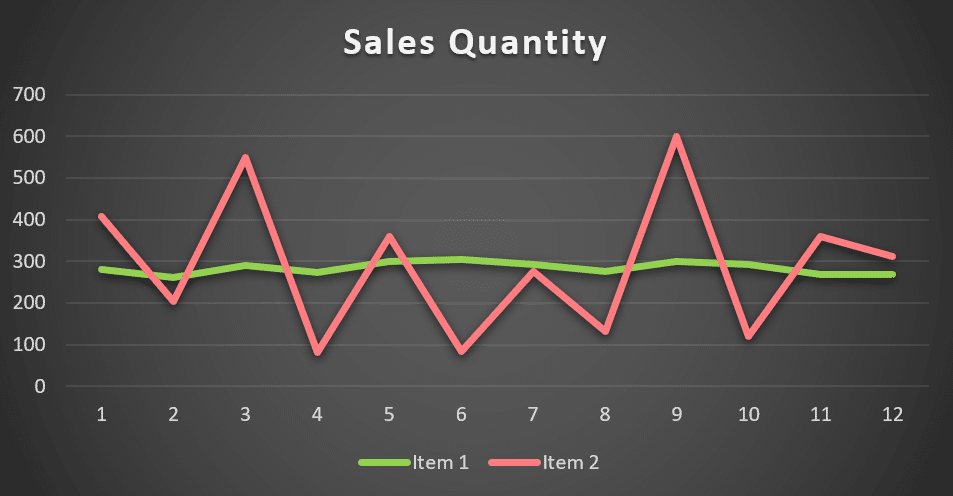
We can see that item 1 sales are much more stable than item 2. We want to quantify this difference.
To have a good estimation of the items’ demand uncertainty, we can use the coefficient of variation (CV). It is simply the standard deviation divided by the average. We can apply the formula over the past 12 months to have a monthly coefficient of variation. The formula can be easily obtained in Excel with STDEVP() and AVERAGE() functions, as shown in the image below (cells D to K are hidden):
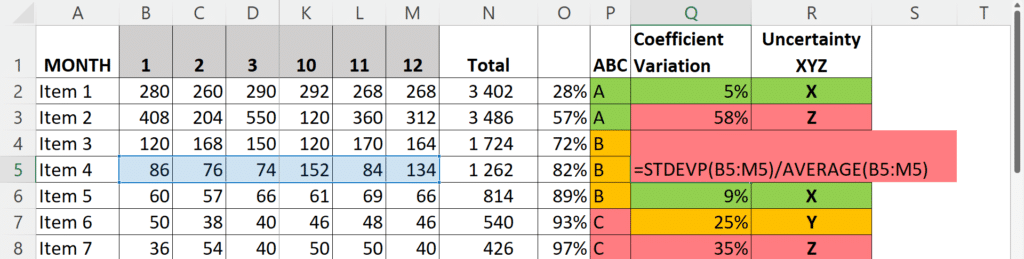
The more unstable your series is, the higher your standard deviation will be. For item 1, we get a 5% coefficient of variation vs 58% for item 2 which is consistent with the graph we saw above.
Then, we need to define coefficients of variation thresholds to classify items in XYZ categories. Here, we assumed:
- CV < 10%: X code
- 10% < CV < 25%: Y code
- CV > 25%: Z code
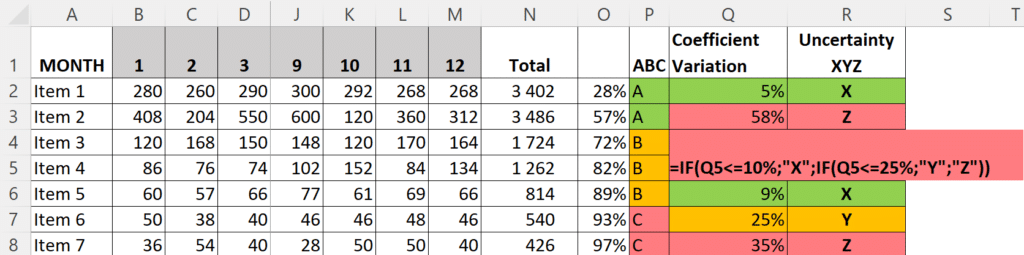
So, Item 1 is an X code and item 2 a Z code.
Of course, those threshold values are arbitrary, and you should adjust according to your data (if you have almost no X items for example). I advise you to set thresholds based on your business specificities: Identify clear patterns and group your items accordingly.
ABC XYZ Analysis: Other Purposes
ABC XYZ Analysis is not only about Inventory Management, this is also a good management tool that can be useful in various situations.
An excellent Supply Chain Education Tool
I have been a Supply Chain Manager and S&OP Manager for many years, and I have used extensively ABC XYZ analysis for educational purposes. I used it in particular to animate S&OP, customer, and supplier meetings:
- Marketing/Sales: to educate them on why it is not possible to have a very high service rate for all the products.
- Finance: to educate them on why it is not possible to lower inventory and holding costs for all the products.
- Production: to tell them why the demand uncertainty and the diversity of service rate targets prevent production schedules to be steady and uniform all year.
- Suppliers/Customers: Educate them on your own challenges and inventory strategy to find trade-offs. For example, I used to explain to customers that we had not in stock some highly unpredictable products because it was part of our policy. And I used to convince them that once I had those items back in stock, I could make fast delivery for them.

A good Crisis Management Tool
ABC XYZ Analysis is also very useful for crisis management.
By caricaturing, you might face situations when your CFO comes to your desk telling you to “cancel all orders because there is no more cash”. Or telling you the opposite, urging you to “double all orders” because you sell surgical masks and plan to make +100% in times of pandemic.
Having your products well categorized is key to taking action quickly in those situations. In the first situation, you could convince your anxious CFO to save at least your most strategic products:

ABC XYZ Analysis limitations
The ABC XYZ Analysis comes with several limitations.
Demand variations and predictability
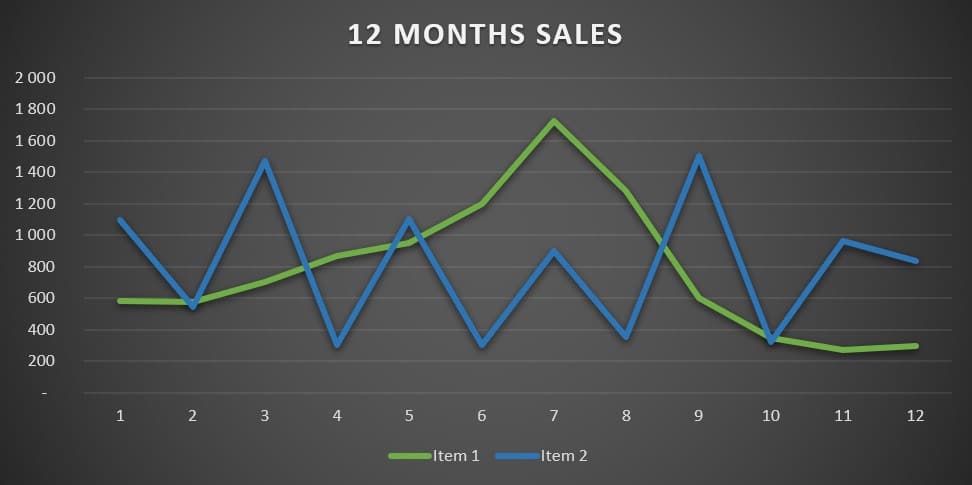
In this article, we used the coefficient of variation to assess the predictability of demand: the higher variations are, the harder it is to forecast demand.
In practice, this is often not a good indicator of demand predictability: some demand patterns are much easier to forecast than others.
In the example above, item 1 has a clear seasonal peak in July, and item 2 demand profile is much more sporadic. A forecast model taking into account seasonality parameters could perform much better with item 1 than item 2. Still, the coefficients of variation are very close (54% and 52%).
To address this issue:
- Use your forecast instead of past sales
- Use your forecast accuracy KPI instead of the coefficient of variation
Is ABC XYZ Analysis good enough?
With ABC XYZ classification, we assume Inventory Management is a 2 dimensions problem (items’ profitability and demand uncertainty). But in Supply Chain, we always deal with multifactor issues. We could add other categories for supply uncertainty, obsolescence risks…
The problem is that any new dimension increases the number of categories exponentially and so the level of complexity. If the level of complexity is too high in comparison to your resources, the level of performance can drop quickly. That’s why I recommend mastering the foundations before seeking more complexity.
ABC XYZ Analysis: Action Plan
- Start your first ABC XYZ Analysis TODAY. You can download the file used in this article below.
- Classify your products ABC first, then XYZ
- Define Service level targets per category
- Track your performance
- Optimize
- Share and Educate
Other Inventory Management content
I recommend you to check out our video tutorials:
- Safety Stock formula to define the right levels of Safety Stock (Excel Tutorial)
- EOQ Formula to optimize the quantity to order (Excel tutorial)
- 11 solutions to optimize your inventory & shortage
Key takeouts from this article
Is ABC analysis enough to manage inventory efficiently?
Not really. ABC analysis is good to rank items by their sales value (A = high value, C = low), but it doesn’t tell you anything about how stable or volatile the demand is. So if you only use ABC, you might have wrong safety stock levels for some products.
What does the XYZ analysis part actually do?
XYZ helps classify items based on how predictable the demand is.
- X items have very regular demand,
- Y items are a bit more variable (maybe seasonal),
- and Z items are just chaotic — you never know what’s coming.
So it complements ABC by adding a time-based dimension.
Why should I combine ABC and XYZ instead of using just one?
When you combine both, you get a 9-square matrix (like AX, BY, CZ, etc.). This lets you make way smarter decisions — for example, an AX item needs tight monitoring and low safety stock, while a CZ item is unpredictable and low value, so maybe you don’t stock it at all.
How do I actually calculate XYZ categories?
You use the coefficient of variation (CV), which is:CV = standard deviation / average monthly demand.
If the CV is low, the item is X. If it’s medium, it’s Y. High = Z.
The article gives actual Excel formulas for it. You don’t need advanced software.
Can I do ABC XYZ analysis in Excel without coding?
Yes, it is possible 🙂 This article includes a full Excel template, step-by-step. You just copy your data (product ID, sales history), and the file does the rest. You’ll get your 9 ABC XYZ categories in minutes.
Become an Inventory Management Expert
If you want to go to the next level, join my next Inventory Management Workshop (free): “How to avoid shortages and overstocks in times of great uncertainty”.

During this webinar, I will share with you:
- My method for dealing with sales and supplier uncertainty: 13 parameters to master
- How to reduce your inventory and increase your service rate simply and automatically
- Excel files and case studies presented live (Zara, H&M, Amazon…)