This guide covers essential Supply Chain Kpis and metrics like , Service Rate, Availability Rate, Stock Rotation (inventory turnover), and Forecast Accuracy to help you measure and optimize your supply chain performance effectively.
You can download my Excel template here.

Which Supply Chain KPIs should you consider?
The challenge for your stock inventory and supply chain management will be to find the right balance between your stock level and the satisfaction of your customer needs (customer availability or service rate). Our graph below summarizes this principle.
The more stock you purchase, the more you will increase your service level. But this curve is unfortunately not linear (not straight). We can see the curve flattening out when you win your last percentages. Also, the more stock you have, the less « efficient » it will be.
Theoretically, to meet 100% of your customer needs all the time, and to face all possibilities (delays, strikes, quality problems, meteorite…), you would need to have infinite stock.
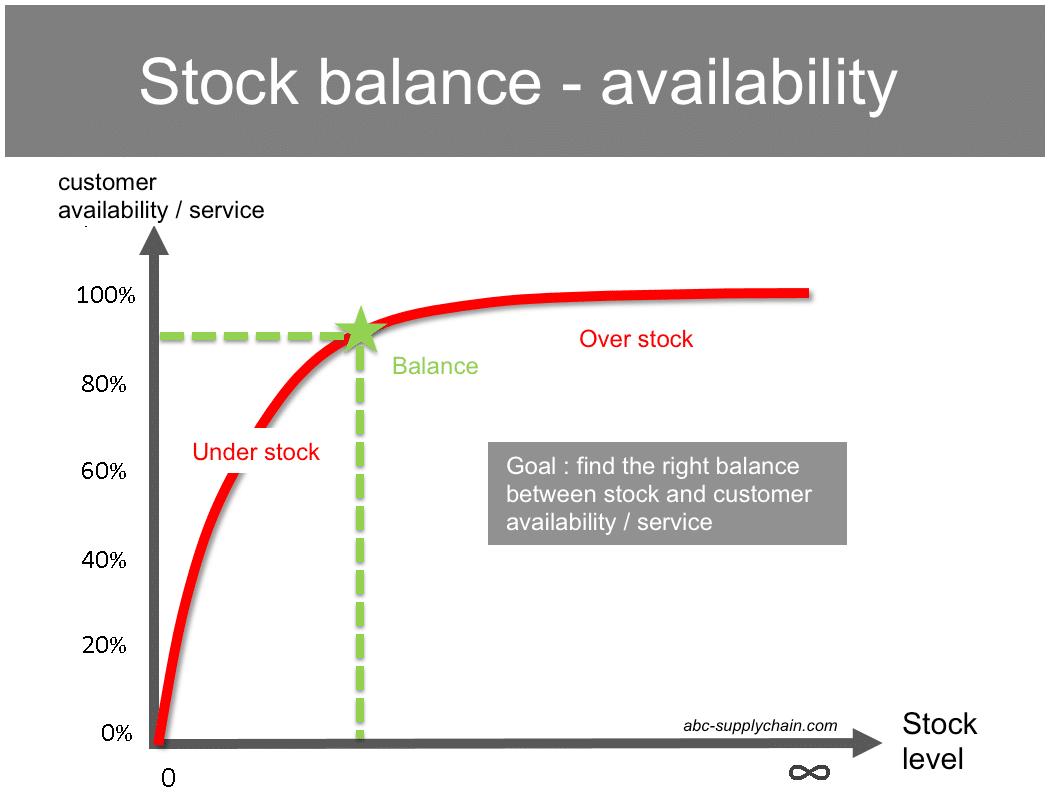
Your objective will, therefore, be to find the right balance between customer availability and stock rotation. This is the challenge for all companies dealing with stock.
To find this balance, it is therefore essential to set up at least these 2 KPIs.
1 & 2: Availability rate or Service rate?
And the answer is… at least one of the two. The availability rate is the % of products available at a given time T while the service rate is the ratio of orders delivered over time to the total number of orders.
The availability rate is mainly used for retail (stores) and distribution to know its availability rate in-store departments.
The service rate is used in other industries when you do not have access to your customers’ stock information. Its advantage is that it is quantity-weighted (or value), unlike the availability rate. If you do not have a store, I recommend using the service rate and you can then use the availability rate as a supplement for your warehouse or factory with an ABC classification (see article ABC management).
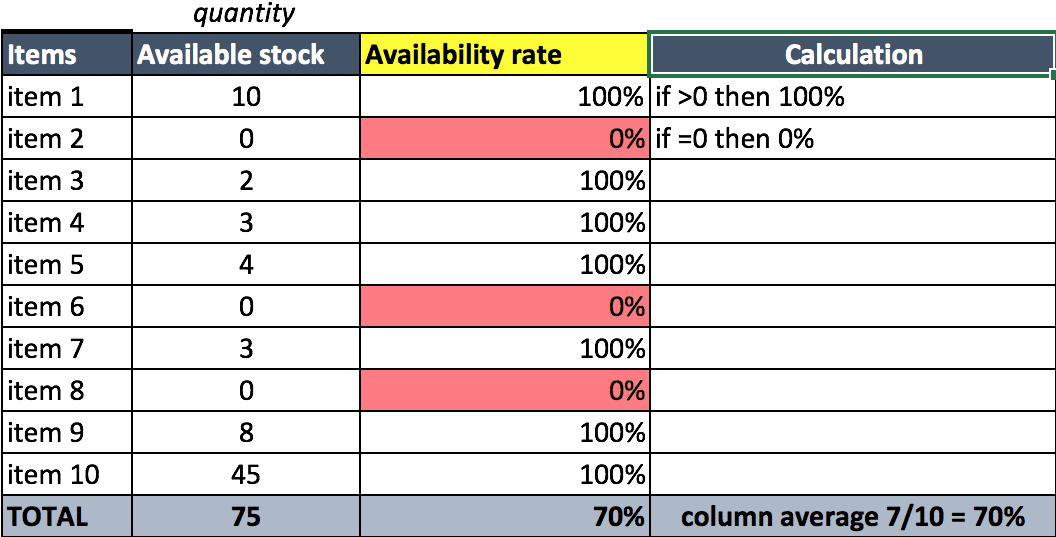
1: Availability rate calculation
In %: out of 100 products, how many are available to the customer (in-store, warehouse…). The table below simply summarizes the calculation on 10 items.
You can download my Excel template here.
Example: I have 100 products in my catalog, only 70 are available for my customers, so I have the availability of 70/100 = 70%.
This calculation is done at the instant T, ideally on the same day. You can average per day afterward. This calculation is only made on the active references of the catalog. Discontinued products and new products not yet in stock are excluded.
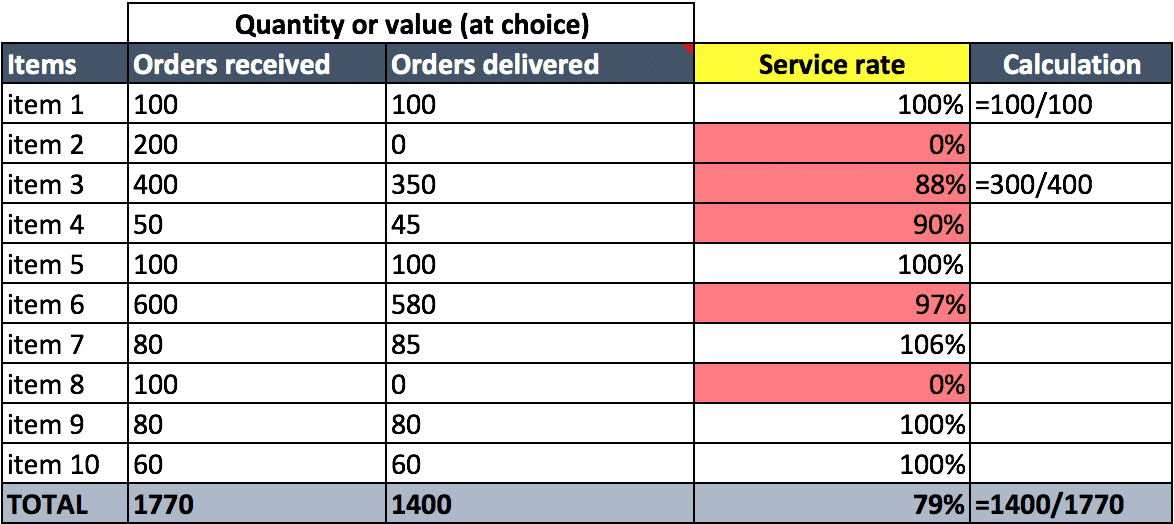
2: Service rate calculation
Service Rate Definition : Out of 100 orders received, the matter here is to understand how many orders are delivered on time.
- Retrieve the complete list of orders received over the desired period. I recommend a one-week period to start.
- Then retrieve on these same items, the orders delivered on time. If these are late, then = 0 in the stock management Excel. If you do not have access to this information, you can take the shipped orders.
- Then simply divide: the orders delivered / order received; to find out your service rate.
- You can simultaneously manage a service rate on time for orders shipped and a service rate on time for orders delivered on time to manage both the quality of your stock management firstly and the quality of your logistics secondly (order preparation + transport times). For example, you can ship 100% of your products ordered by your customer but only deliver 50% within the time requested by your supplier. Service rate = 100%, service rate on time = 50%. In supermarkets, late orders are automatically refused upon receipt but having these 2 separate indicators allows you to identify if the problem comes from your stock or your delivery.
- Keep this service rate at least once a week/month to measure your performance and build a record.
You can download my Excel KPI template here.
3: Stock rotation calculation
Also called stock life or stock coverage, it is the average number of days that the stock takes to run out. This calculation must be done over the last 52 weeks to have a reliable KPI that takes into account seasonal fluctuations as the lower the number of days, the more efficient your stock is. If stock rotation is extremely low, it is likely that you do not have enough stock and therefore, risks of shortage increase.
What period of time?
It is recommended to always take a long period of time (e.g. a full year) to avoid being impacted by your seasonal fluctuations. For example, if you have a big peak of sales for Christmas, you will have a lot of stock before with few sales (many days of stock) before the peak then many sales and few stocks after the peak. By taking a year, you will know on average how many times the stock rotates over that year. If you have items with a short shelf life, do this calculation per month, or over the (more complex) shelf life of the product.
Value or Quantity?
I strongly recommend working on a value (cost) basis and not on a quantity basis because this stock represents your fixed assets. If you improve your purchase prices, you improve your stock rotation in value (not in quantity).
How to Calculate the average Stock?
Ideally, you should average your stock day by day over the targeted timeframe. Very few companies have this stock record available per day. I, therefore, recommend that you at least average your stock per week or per month. If you have no record, simply take the average between the beginning and end stock of the chosen period.
Calculation: Average Stock / Total Sales x Number of Days within the selected period
Be careful here to take the same period for stock and sales in the calculation.
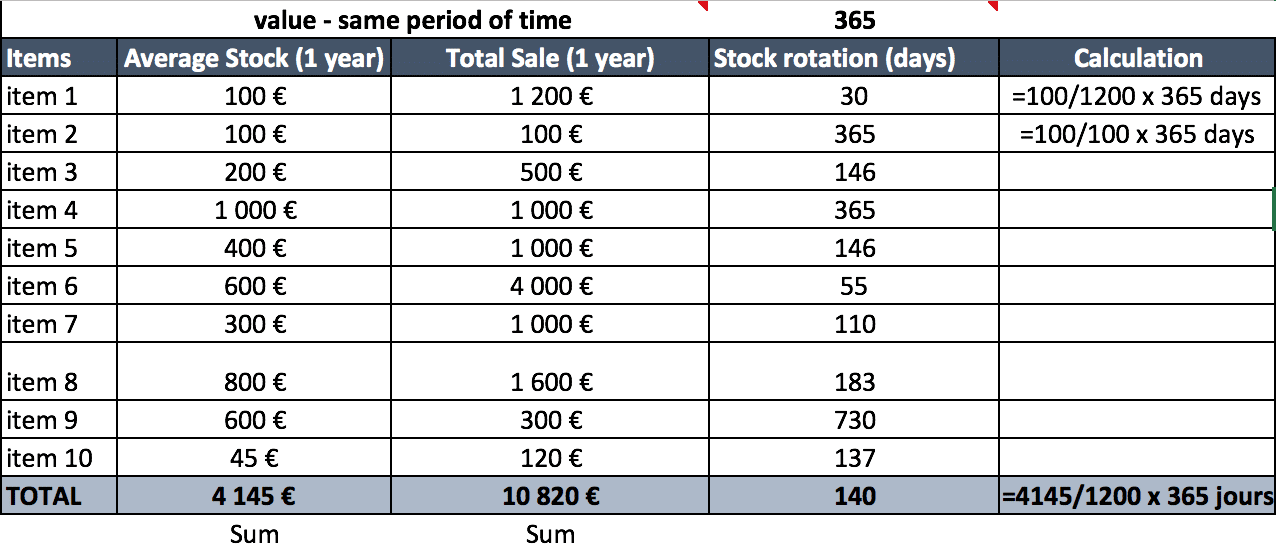
Calculation: Average stock in value on the last 52 weeks / Total sales x 365 days
Example: Let’s assume that your average stock in 2016 is $1,000,000 and your average daily sale is $5,000 per day.
Stock life = 1,000,000 / 5,000 = 200 days.
It is pivotal to calculate this KPI in value terms, as large quantities of products can have a significant impact on the total. Indeed, your financial asset is in value, not in quantity.
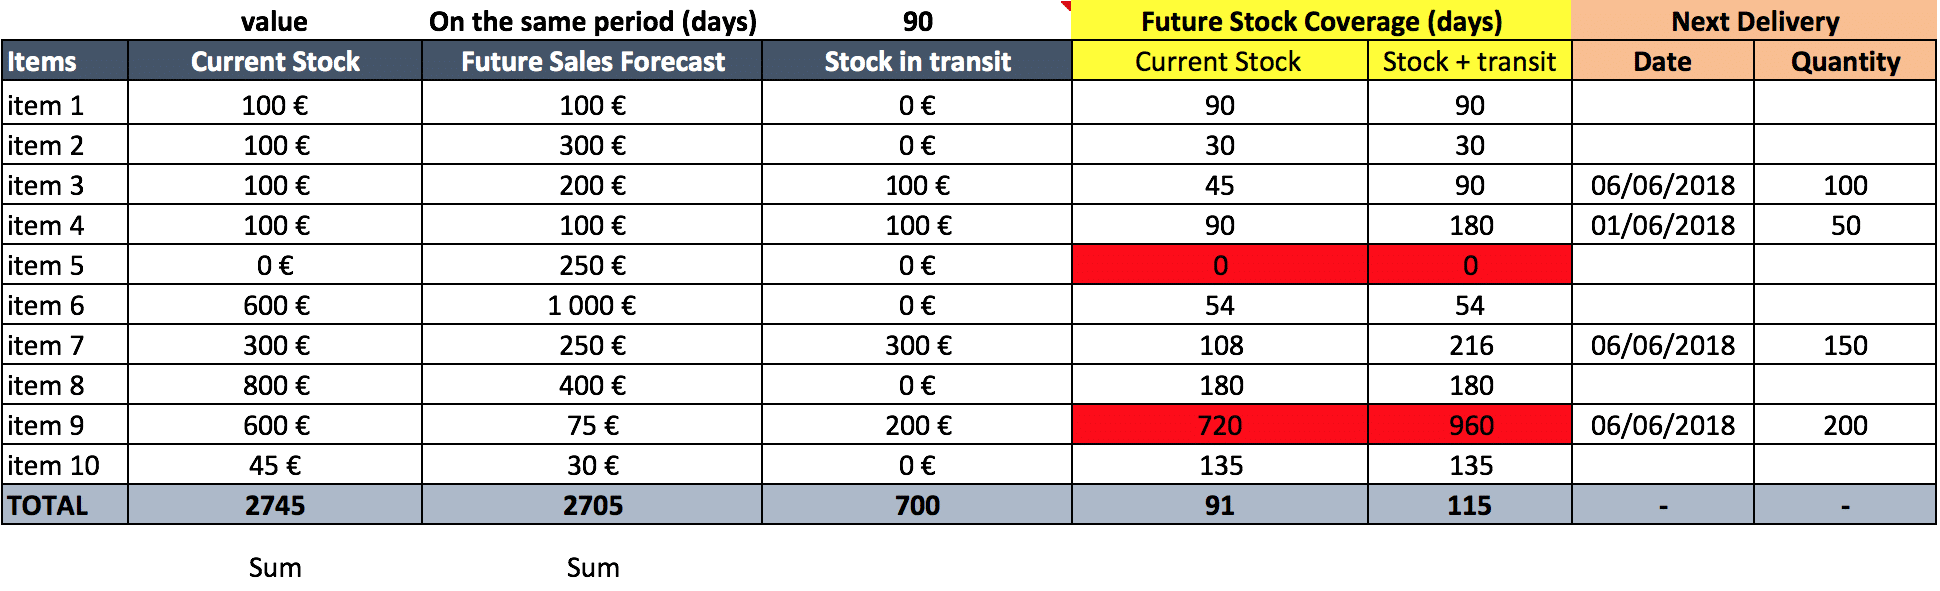
4: Stock coverage calculation
Instead of using past sales, you can use future sales forecasts to estimate your future inventory turnover. In this case: average stock = current stock + stock in transit (with or without, it is your choice).
This calculation is not perfect because to be correct, it would have to take into account the seasonal fluctuations and arrival dates of each order. However, it will alert you to the future risks of breakage and overstocking.
That’s why I recommend adding 2 columns:
- a column: Next date of receipt
- a column: Next reception quantities
This is to quickly see if your next order arrives in time not to be out of stock or too early not to be over-stocked.
Note that if you already have an ERP such as SAP, you can most likely extract the actual stock coverage per item.
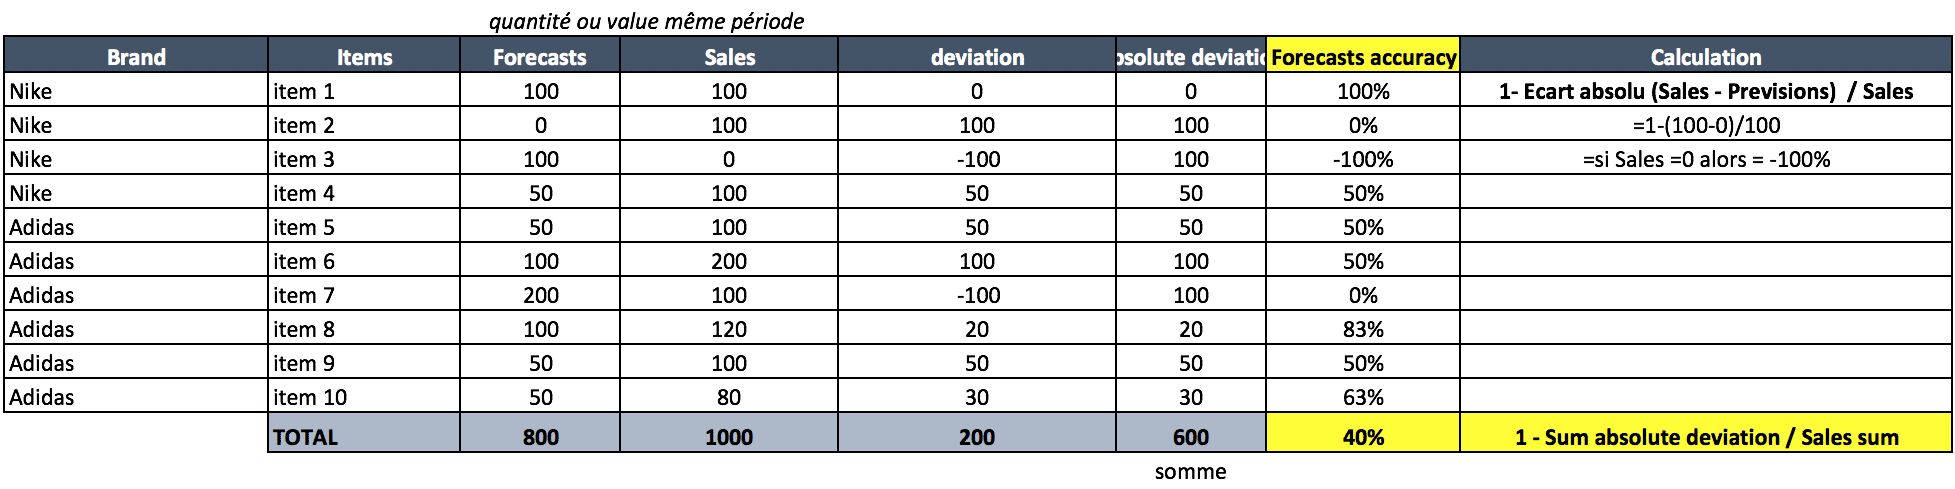
5: Forecast accuracy calculation
- Retrieve your forecasts by item and your sales over the desired period.
- On what horizon? There are thousands of ways to calculate your forecast accuracy. The real question is over what horizon? That is, how long is the time between the moment you made your forecast and the moment of your sales. 1 month? 6 months? I recommend using at least the average duration of your supply. If you have a 2-month average duration, compare your sales with your forecast made 2 months before. If you compare it to the previous month, it is no less interesting, because if this time is too short to react, it is also a way to start simply.
- Absolute difference: This is the calculation of the absolute average difference between your sales and your forecasts, article by article because even if you sell 50 quantities more or less, the difference remains the same: 50. Using the absolute difference (not the difference) is fundamental when calculating several materials, otherwise, the sum of the differences could cancel each other out. In this example, we can see that the sum of the differences is only 200 quantities, which refers to a 20% difference between forecasts and sales. But in reality, by taking the absolute difference, we are at 60% of the average difference, i.e. 40% of forecast accuracy and not 80%.
- Calculation: 1 – (sum absolute difference per item / total sales)
5 other KPIs for your supply chain
Be careful not to make your animation too complex with too many KPIs for your supply chain. I highly recommend avoiding too many metrics at the beginning if you have not yet set up the first ones.
Others Metrics for your supply chain :
- On-time delivery (DOT = Delivery on time). This is the percentage of orders in quantity delivered on time.
- Lead Time for customer and supplier deliveries.
- Logistics and transport costs (average cost per item or % of turnover).
- Markdown rate (% stolen or missing value)
- Warehouse occupancy rate (% of available space)
Download Excel Kpis
You can download my Excel template to calculate the leading supply chain indicators like Service Level, service rate, fill rate, OTIF, DIFOT, DOQ, DOT jut below :
What’s important to remember
What are the key KPIs to monitor in supply chain management?
Essential KPIs include:
Availability Rate: Measures the percentage of products available to customers at a given time
Service Rate: Assesses the proportion of customer orders fulfilled on time.
Stock Rotation: Indicates how often inventory is sold and replaced over a period.
Stock Coverage: Shows the duration current stock can meet anticipated demand.
Forecast Accuracy: Evaluates the precision of demand forecasts compared to actual sales.
How do Availability Rate and Service Rate differ?
While both measure product availability, they focus on different aspects:
Availability Rate: Reflects the percentage of products available at a specific moment, commonly used in retail settings.
Service Rate: Represents the ratio of orders delivered on time over a period, often used when direct stock information isn’t accessible.
Why is Stock Rotation important?
Stock Rotation, or inventory turnover, indicates the efficiency of inventory management by showing how frequently stock is sold and replenished. A higher turnover suggests effective sales and inventory strategies, while a lower rate may point to overstocking or sluggish sales.
What does Stock Coverage reveal?
Stock Coverage calculates how long current inventory levels can satisfy projected demand. This metric aids in planning replenishments and ensuring that stock levels align with consumption patterns, helping to prevent both overstocking and stockouts.
How can Forecast Accuracy be improved?
Enhancing Forecast Accuracy involves:
Collaborating Across Departments: Engage sales, marketing, and supply chain teams to gather diverse perspectives.
Analyzing Historical Data: Review past sales trends to inform future predictions.
Incorporating Market Insights: Consider factors like market trends, seasonality, and economic indicators.
Regularly Updating Forecasts: Continuously refine forecasts based on the latest data and insights.
Leveraging Advanced Analytics Tools: Utilize software and models designed to enhance forecasting precision.
Become a SCM Analytics Expert
If you want to go further and learn how to set up the best KPI for your Supply Chain & Logistics, track your performance on Dashboard and have access to exclusive Excel templates, you can join our new online course to Measure & Track your SCM performance here
Master Excel Dashboard & SCM Analytics
Make sure to also check my Safety Stock article: Safety Stock Formula & Calculation: 6 best methods