Too often neglected, OTIF, DIFOT, service level, and fill rate are essential indicators in supply chain management. They can drive satisfaction or cause stress, especially when products are out of stock, creating frustration for both businesses and customers. This is why it’s crucial to measure these indicators as accurately as possible.
In this article you will learn how OTIF, DIFOT, and fill rate metrics can transform your supply chain’s performance. We will discover the key formulas and methods for calculating on-time, in-full deliveries, along with actionable tips to boost customer satisfaction and operational efficiency.
(OTIF, DIFOT & Fill rate step-by-step tutorial video below)

Triangle of supply chain performance
How to have a profitable Supply Chain? The answer may seem obvious: improve the level of service for your customers while minimizing inventory levels as well as production costs.
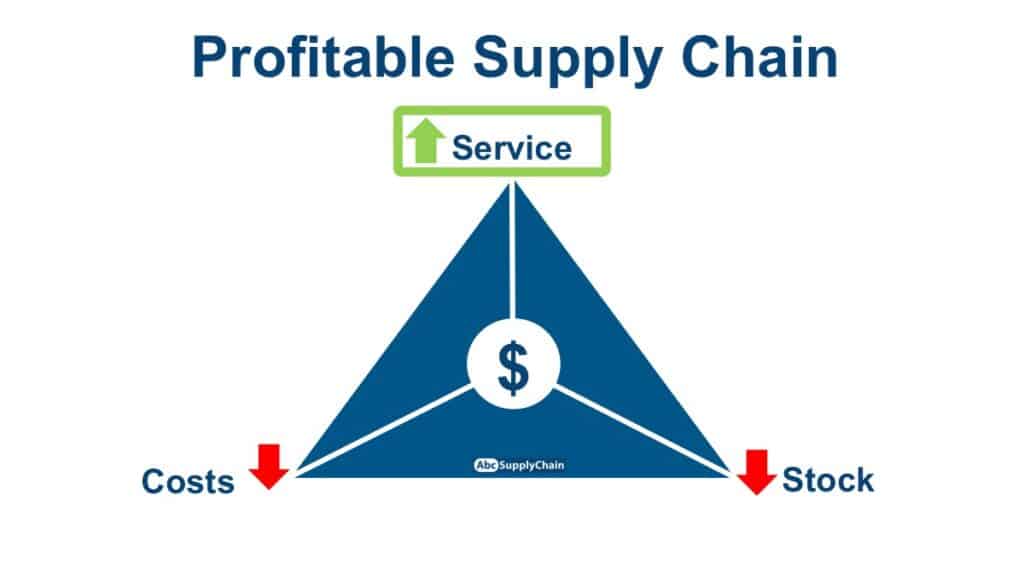
It seems obvious, yet on the ground, it is more complicated. In order to help you, we will focus on the service level: how to measure it and how to improve it. (no matter your industry).
Measure your customer service level
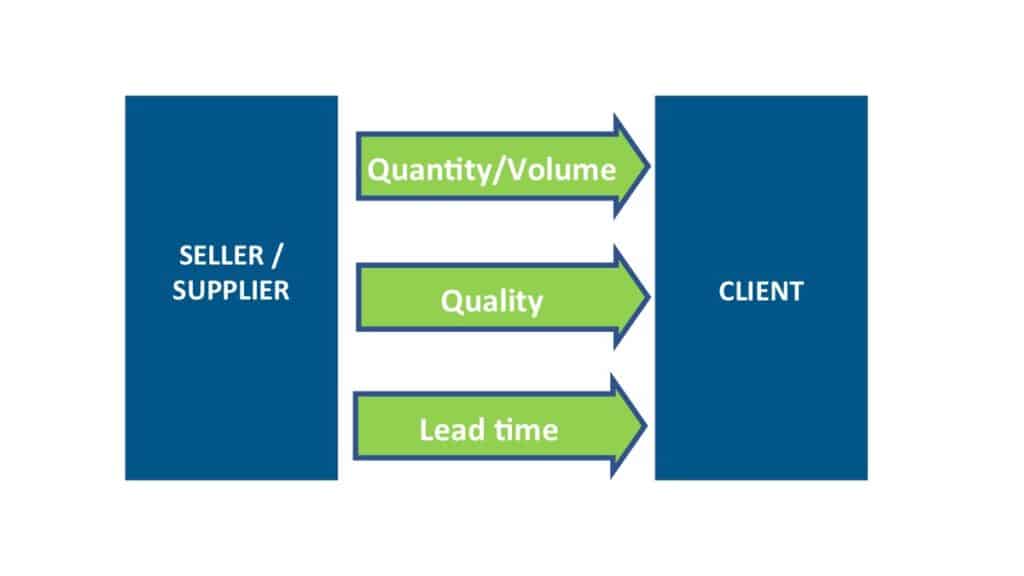
Whichever your position in the Supply Chain, it is imperative to measure your service rate to improve your performance and your customer satisfaction.
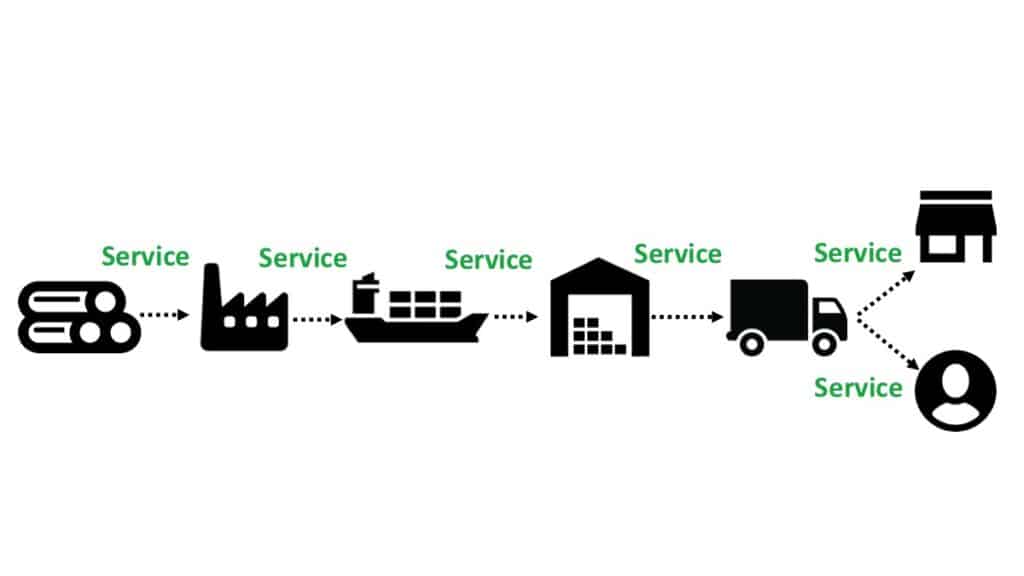
You will always measure this rate between a seller/supplier and a customer via 3 main approaches :
- Quantity or volume
- Quality
- Lead time
Differences between availability rate and service rate?
Let’s start with an example between Coca-Cola and Walmart. Walmart was number 1 in distribution (before being overtaken by Amazon), and has very large supermarkets, mainly in the United States. It naturally distributes Coca-Cola products in stores, but also on its website for home deliveries.
First, you have the Coca-Cola factory, which will deliver to the Walmart warehouse where pallets of Coca-Cola products are going to be stored. The first step in measuring the level of service is to measure the percentage of service between these two players, therefore the percentage of quantities delivered, the level of quality, and the level of lead time.
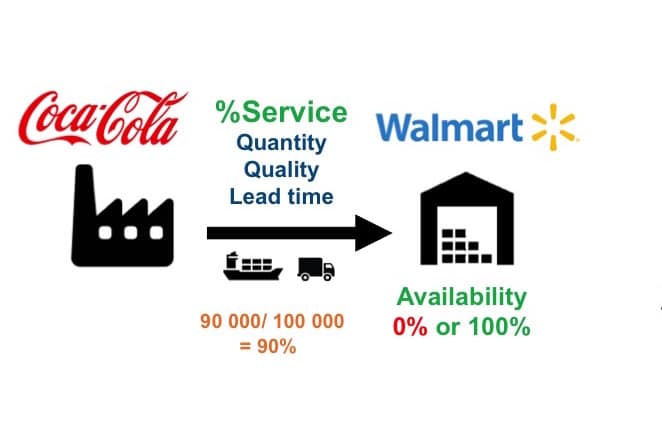
Example:
If Walmart orders 100,000 bottles, but Coca-Cola can only deliver 90,000 within the time limits, then we have a service rate of 90%.
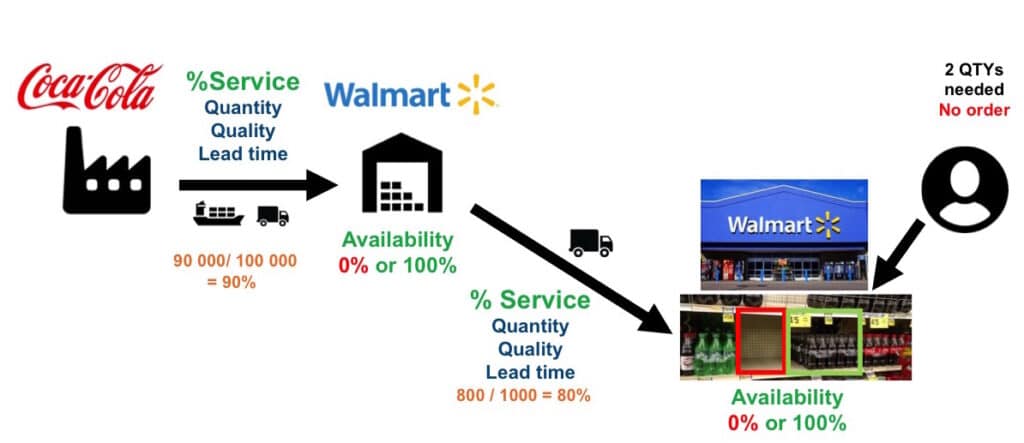
Then, the Walmart warehouse will receive orders from its stores. The same formula applies to measure the service rate with the 3 axes: quantity, quality, and lead time.
Next, we want to assess the level of service impacting the customer that arrives in the Coca-Cola department at the Walmart supermarket. In this situation, you won’t be able to calculate a service rate because the customer will not order in advance. You will just “take a picture” of the current situation to see if the product is available or not. We call this metric the fill rate, which is 100% (available) or 0% (not available).
Finally, the customer can choose to order directly from the website. Here again, the customer will not order in advance. We can therefore only measure whether the product is available or not. When the product is available on the website, it’s usually related to warehouse availability.
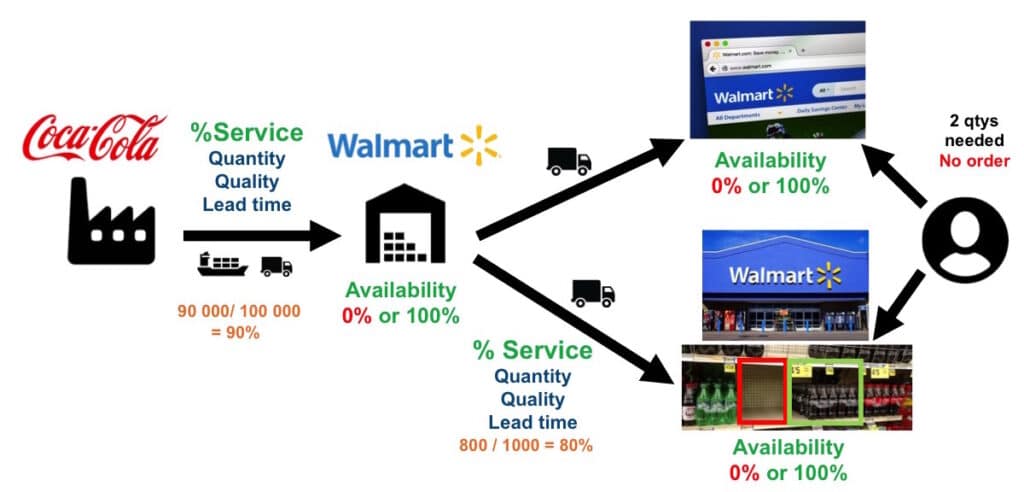
To summarize: when we have an order, we can refer to the service level according to 3 points (quantity, quality, lead time). If we do not have an order, we must rely on the availability rate, either 100% if we have at least 1 product, or 0% if it is out of stock.
Quantity ? Value ? Volume? Weight?
This is a question people often ask me.
Usually, companies work in terms of quantity (I use this standard in my Excel example), but it depends on your industry.
The important parameter to consider is the price difference, the difference between the selling price and the cost price. If you have very large price differences, you can work in terms of volume, especially if you are selling/supplying raw materials. If you work in distribution, my recommendation is to work in selling price (or cost price/purchase price if you work in the industry).
Remember that our goal is to increase revenues and profits. So working with service rates that use product value will allow you to give more importance to the products that generate the most income.
Calculations and examples on Excel
Let’s calculate these indicators in Excel with concrete examples. You can download the full Excel below:
Availability rate : calculations on Excel

Available stock: available products (and not physical stock).
We will only measure the availability rate of active products. If you have discontinued SKUs (end of life products or end of collections), they should not be part of the calculation because you cannot guarantee the availability of discontinued products to your customers (eg. product 7)
- If the available stock > 0 then Availability rate = 100% (example Product 1)
- If available stock = 0 then Availability rate = 0% (example Product 2)
To have the total availability rate, you must calculate the average of all of these products (therefore removing the discontinued products). I also recommend using an ABC classification.
Service level : calculation on Excel
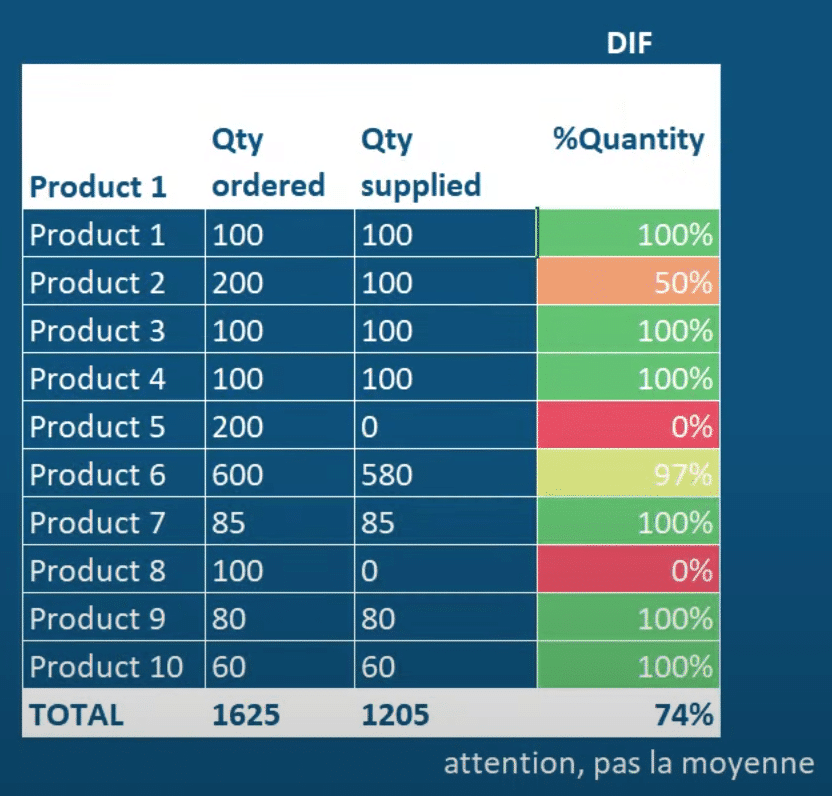
The formula of the fill rate or service level is a bit more complex than the previous one. We always have the same catalog of 10 products, with the quantities ordered and the quantities delivered. We will get the percentage of quantities delivered (DIF = Delivery In Full) by dividing the quantities delivered by the quantities ordered.
Fill Rate = DIF (Delivery in Full) = %Quantity = Qty supplied / Qty Ordered
Example Product 2 : 100/200 = 50%
If you have a case of 0 quantity ordered, then: Service level = 0% (Use of the IFERROR formula on Excel to avoid errors on this case)
The overall service rate is not the average of the service rate by item. It is calculated with the total quantity supplied and ordered (so it is weighted by the quantities).
Example below : DIF Total = 1205/1625 = 74%
If you want to go into more details and measure the entire level of service, you can add the quality (DOQ) and lead time (DOT).
DOQ Calculation :
To calculate the DOQ (Delivery On Quality), you have to gather the quality problems, which are generally declared at the time of delivery. These are the non-compliant products, and they are calculated by dividing them by the number of products delivered (only products that we can check). Once again, the overall DOQ is weighted by the quantities.
DOQ ( Delivery on Quality) = %Quality= 1 – Qty supplied with quality issues / Qty Ordered
DOT Calculation :
As for the DOT (Delivery On Time), you must check if the suppliers’ commitment has been kept. Therefore, you gather the quantity of products delivered on time, and you divide them with the total quantity of products delivered in order to obtain a percentage ratio.
DOT = Delivery On Time = OTD = On Time delivery= Quantity delivered on Time / Quantity supplied
Exemple product 6 = 500 /580 = 86%
OTIF (or DIFOT) Calculation :
Finally, to get the OTIF (On Time In Full) or DIFOT (Delivery In Full, On Time), or the total service level, you will multiply each ratio (quantity, quality, lead time). You just need to multiply the 3 indicators between them.
DIFOT = DIF x DOQ x DOT
Example total 10 items : 74% x 90% x 78% = 53%
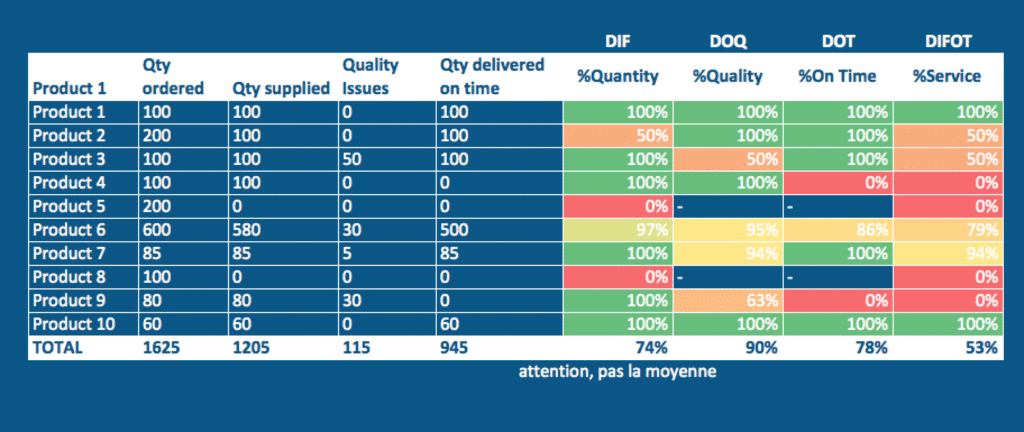
Keep in mind that the most important calculation is related to the quantities delivered (DIF). You can add more metrics related to the quality and lead time if you want the service rate assessment to be more precise.
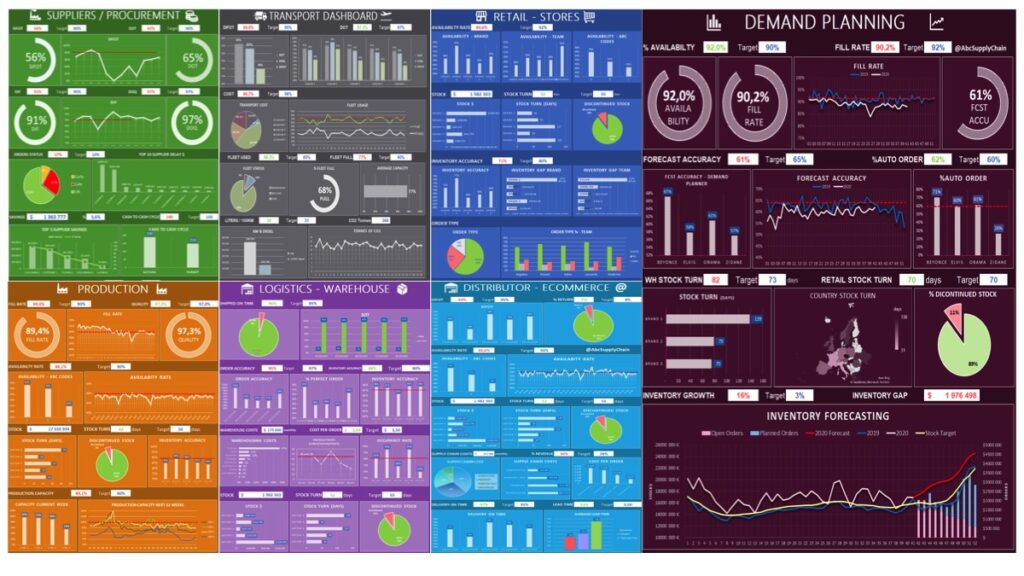
Full Supply Chain dashboards
You are generally required to work with a lot more products than in my example, or even several brands. In order to see more clearly and to measure its performance, it’s important to create Excel dashboards like the ones I propose in SCM Analytics via different templates and complete dashboards.
5 tips (and mistakes to avoid) to boost your service level
1) Pay attention to the quality of your data
You have to be careful with the quality of the data in your product catalog. This means ensuring that the product codes are correct, indicating whether they are active or inactive. If you get it wrong from the start, your calculations will be wrong.
You should also be careful with your stock by doing inventories frequently. If the data related to your stock are false, so will be your calculations.
For the orders, everything must be recorded, even those relating to products out of stock. Moreover, you have to be transparent with your suppliers and customers. Sharing information is essential in order to maintain good communication between all parties.
Finally, it’s important to have a maximum of historical results of your service rates to be able to understand trends, analyze and continuously improve your processes.
2) Do not target 100% service rate and fill rate
It’s impossible to reach 100% service rate for 100% of your product all the time. It would be a disaster for the profitability of your business. Sales and marketing departments tend to insist on having a 100% uptime rate, however, this is unrealistic.
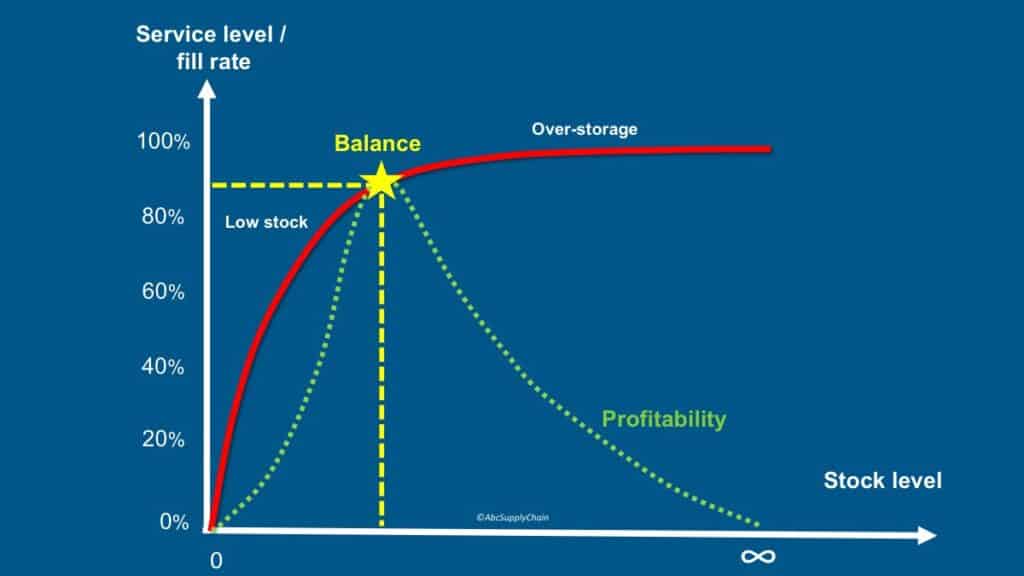
When you have low stock, you will increase your service rate easily. However, above a certain level, it will lead to over-stock (you will be forched to make promotions or to throw away).
If you want 100% service rate you need infinite stock which is impossible. You will then have to find the right balance in order to ensure your profitability.
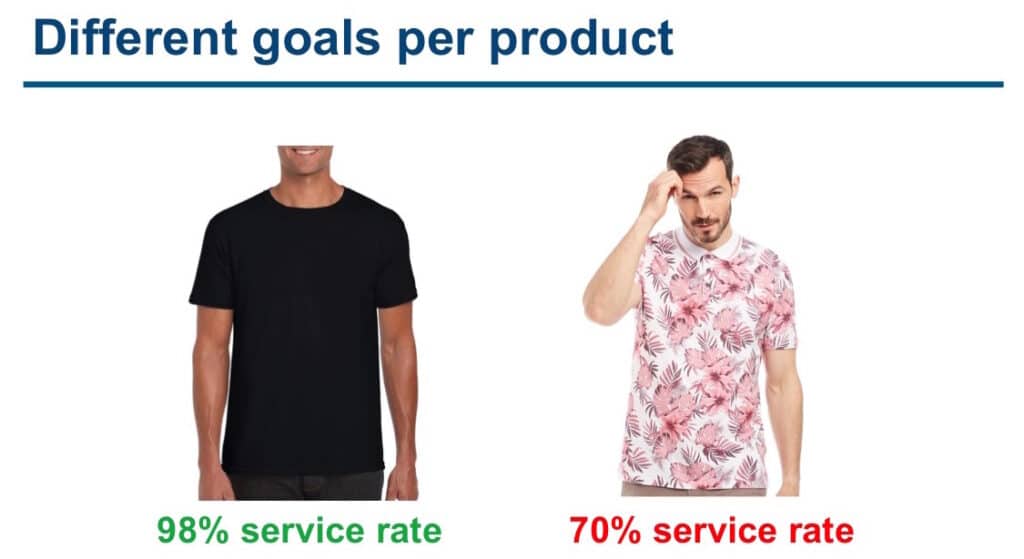
3) Focus 20/80
To get the right balance, you need to have different goals per product. For example, make sure you get the best service rate for your bestsellers (A CODE), and set the service rate for slow moving products (C Code) lower.
In order to define these objectives, I advise you to perform an ABC classification in order to define your priorities. You will find all the necessary information on the ABC method here.
You should also consider including the level of uncertainty of your product to target different service level. See all about ABC XYZ analysis here.
4) Automate your reportings
I see a lot of people in companies spending too much time measuring and updating dashboards when they should be spending that time on analysis and optimization.
You have 2 solutions:
- Extract your data from your ERP or software (SAP, Sage, Oracle, AS400, JDA …) then calculate your indicators automatically in Excel before making the right decisions and acting on your ERP (Orders, parameters, etc.)
- Prepare a mockup on Excel with all your indicators. Once the process has been tested and validated, develop these KPIs on your ERP or BI software (Power BI, Tableau, Qlik, MicroStrategy, etc.)
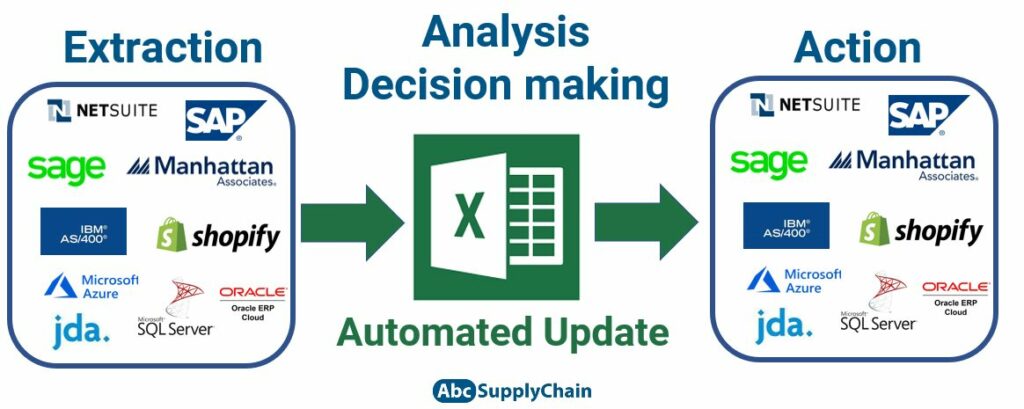
You need to start your Monday with ready-to-use data, rather than struggling every week for hours to update your Excel charts.
5) It’s ok to have shortage, just relax and take a step back
My last advice, but not the least, is to put into perspective as your service rate is concerned. I see a lot of stress generated by this indicator, whether it is in teams, between customers and suppliers or even between departments.
In my opinion, it’s important to perform well but not at the cost of your professional and personal well-being. Do your best, be methodical and factual, and don’t add the extra pressure to yourself.

The field of supply chain is very stressful in general, no matter the job. If you want to keep performing well, you must keep having fun at work above all.
Now it’s up to you to put all the advice in this article into practice in order to improve your service rate and ultimately your profitability. You will find my downloadable Excel by clicking on the button below.
Download the Excel Kpis template
Download the OTIF-DIFOT-Service Rate Excel just below and start tracking this strategic KPI :
Key takeaways from this article
What’s the real difference between OTIF, Fill Rate, and DIFOT?
Even if they’re often mixed up, these KPIs measure different things. Fill Rate (or Service Level) focuses on the quantity delivered vs. ordered. OTIF and DIFOT usually combine on-time delivery with full delivery. If you deliver 100% of the quantity, but it’s late, it doesn’t count as OTIF.
How do you actually calculate Fill Rate?
Pretty simple: it’s the quantity delivered divided by the quantity ordered. For example, if a customer orders 200 units and you deliver 100, the Fill Rate is 50%. But you also need to be careful — if the quantity ordered is zero, the rate becomes undefined, so use something like IFERROR in Excel to clean that up.
What is the Availability Rate and how is it different?
Availability Rate is more of a snapshot — it tells you if a product is in stock or not, without needing a customer order. If there’s at least one unit available, it’s 100%. If not, it’s 0%. Very useful for e-commerce or shelf availability.
Should I calculate service rate in quantity, value, or volume?
Most companies go by quantity, but it depends on your business. If you sell raw materials, maybe volume makes more sense. If price differences between products are huge, using value is better — it helps focus on high-margin products that really drive profits.
Is it realistic to aim for 100% service level?
Honestly? Not really. Trying to reach 100% often leads to overstock, stress, and wasted resources. The article recommends focusing on your top 20% products (80/20 rule), cleaning your data, and automating reporting before chasing perfection.
Articles and tools on the same subject :
10 KPIs for your Supply Chain
10 Ways to Optimize your Inventory
Safety Stock Formula & Calculation : 6 best methods