Demand forecasting can quickly become overwhelming. But sometimes, the simplest tools are still the most effective. One of my go-to methods when I need a quick and reliable forecast is the good old moving average.
It’s not perfect, but it gets the job done, especially when things are stable and you’re focused on short-term planning.
Here is our complete Moving Average template in Excel follow along:

The Basic Moving Average Formula (That You Might Already Know)
Here’s the moving average formula in plain English:
Take the demand from the past few periods, add them up, then divide by the number of periods.
For example, a 3-month moving average would be:
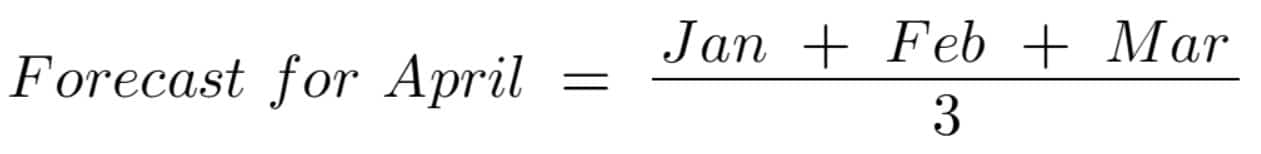
This gives you a forecast for April. That’s literally it.
Why Moving Average Forecasts Are Still Relevant in 2025
Even with AI forecasts, advanced tools, and predictive analytics everywhere, I still see planners using moving averages.
Here’s why:
- It smooths out noisy data
- It’s transparent: easy to explain to your manager
- It doesn’t require fancy software
- You can build it in Excel in 2 minutes
Seriously. I’ve done it live in Excel during a meeting more than once when someone asked “what will demand look like next month?”
How to Build a Moving Average Forecast in Excel
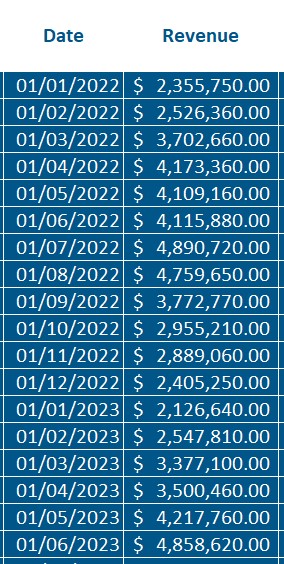
Let’s walk through the process using the examples from our downloadable Excel file:
1. Choose Your Forecast Horizon and get your historical data
Decide how far ahead you want to predict: 1 month, 3 months, 2 years? This defines how and when you’ll use your forecast.
IIn our example, we have historical data from 2022 and 2023 and want to forecast until the end of 2025. That’s long-term financial planning.
2. Select the Number of Periods to Average
Decide how much past data you want to smooth (e.g. 3, 6, or 12 months). Shorter = more responsive. Longer = more stable.
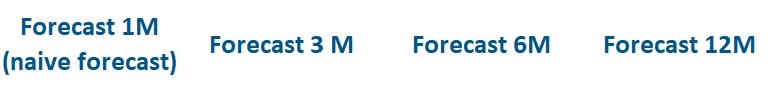
In our example, we compare 4 different moving average periods. Note that, here, a 1-month average is just a naive forecast (last value = next forecast).
3. Build the Moving Average Forecast in Excel
- Put your sales data in a column (B2:B13 for example)
- In the next column, use:
=AVERAGE(B2:B4) - Drag the formula down
Put it on the graph, and voilà: you’ve got a 3-period moving average forecast.
Here is the result in our example after calculating 1, 3, 6 and 12 periods moving average:
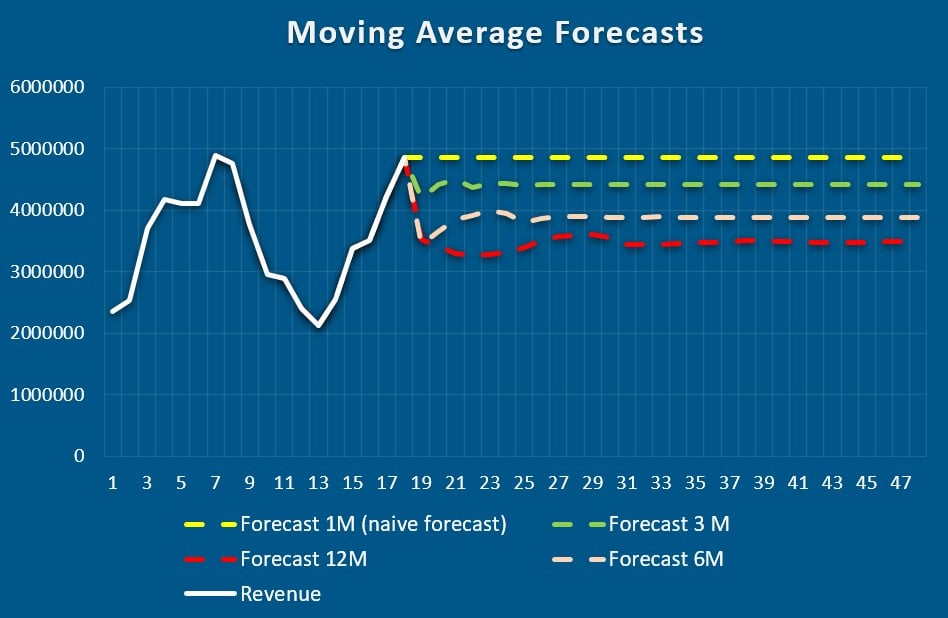
We had a recent sharp increase in revenue just before the first forecast point. The naive forecast (1M) reflects that jump immediately.
The longer the moving average window, the slower the forecast is to catch up.
This perfectly illustrates the lag vs. noise trade-off:
- Short MA = fast but volatile
- Long MA = smooth but slow
4. Benchmark Against Other Forecasting Models
Once your moving average forecast is ready, compare it to alternative methods like:
- Naive forecast (last value = next forecast)
- Exponential smoothing
- Linear regression (for trends)
- Seasonal models (if applicable)
Use metrics like MAPE, RMSE, and Bias to see which model performs best on your historical data.
This step turns your moving average into a benchmark — and helps you make informed decisions about upgrading (or keeping it simple!).
When to use Moving average in Supply Chain Planning (and When Not To)
Use it for short-term planning and stable demand
This method works well when your demand is:
- Works well when demand is fairly stable
- Ideal when you review forecasts frequently (weekly/monthly)
- Better when products don’t have strong seasonality or big promo swings
Take a look at the “Short-term Planning” chart we used in the article: it is like a “zoom in” of our precedent graph, with a 1-year horizon instead of 4 years.
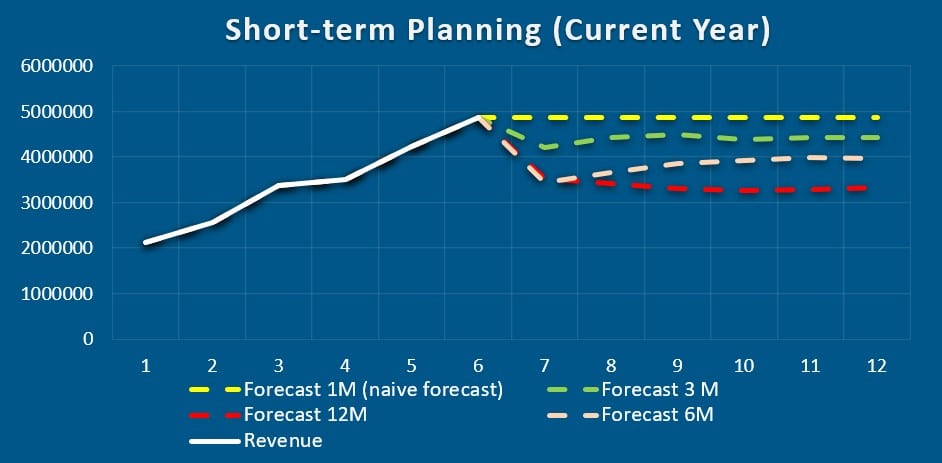
It demonstrates how a 1-month or 3-month moving average responds quickly to the latest revenue increase, making it a good fit for short-term decisions. The 6-month and 12-month averages lag behind, which would delay reactions in real planning.
Watch out for seasonality and product launches
If demand shifts due to seasonality or you’re launching new SKUs regularly, a simple moving average might underperform. You’ll need tools like seasonal indexing or exponential smoothing.
In our example, I intentionally used a dataset with trend and seasonality to show that this isn’t the best model in that case, but it’s perfect for stable SKUs.
“Short-term” Is Always Relative
If tomorrow is Black Friday, even a 1-day forecast isn’t stable. The real question is: how much can change in your forecast horizon?
- 1 day ahead in fast fashion might be chaos
- 1 month ahead in cement distribution might be calm
- 3 months ahead for ocean freight lead times might already be locked-in
It’s about volatility per time unit, not just time.
Real Example
When I worked with an FMCG brand, some SKUs had steady weekly sales. We used a 4-week moving average in Excel to forecast next week’s demand, with around 80% accuracy. Good enough to make inventory decisions without complicating things.
For less predictable products (“Y” and “Z” products), I still use moving averages for short-term planning, but switch to more advanced models for long-term forecasts.
Moving Average Formula: Quick FAQ
What is the moving average in forecasting?
A way to smooth past demand data and project future values, often used when trends are stable.
How do I calculate the moving average in Excel?
Use =AVERAGE(range) over the number of periods you want, then drag it down.
Is the moving average model accurate?
For stable, non-seasonal items, yes. For seasonal or highly volatile products, not so much.
Final Thought
You don’t always need a neural network to make good decisions. Sometimes, just averaging the last few months is all you need to avoid stockouts or overstocks.
Get your moving average forecast for short-term planning, frequently review your most important products, and you’re good to go!