In Supply Chain, data management and processing are vital. To be able to pilot physical flows, it is essential to master information flows: the processing and analysis of these flows is done through Information Systems.
Very often, Excel serves as an intermediary between information systems and users. It is sometimes used fully as a supply chain management tool for small companies that have not invested in Planning Software or ERP packages. Microsoft Excel has therefore naturally taken a very important position for flow controllers, forecasters, procurement managers, … up to project managers and Supply Chain directors.
However, another tool has been in the news a lot in recent years: Python. Supply chain professionals are learning about Python, and some are using it daily to analyze their ERP data.
This trend was confirmed in my recent survey on strategic programming languages in Supply Chain:
I sometimes even hear it said that “Python is the new Excel.” What is it really like? Can we consider this tool to be indispensable for the Supply Chain professions? Will it make our old Excel spreadsheets obsolete?
Python and Excel do not have the same purpose
When I hear people comparing both tools, I realize that they are missing a key point: they were designed for very different functionality.
Excel is first and foremost a spreadsheet: the simplicity of its graphical interface allows any user to manipulate data, without any notion of the underlying code.
Python is a programming language: its use is not limited to data management; one can develop extremely varied programs. It is obviously necessary to learn to code in order to use Python.
So why do we often equate these two tools?
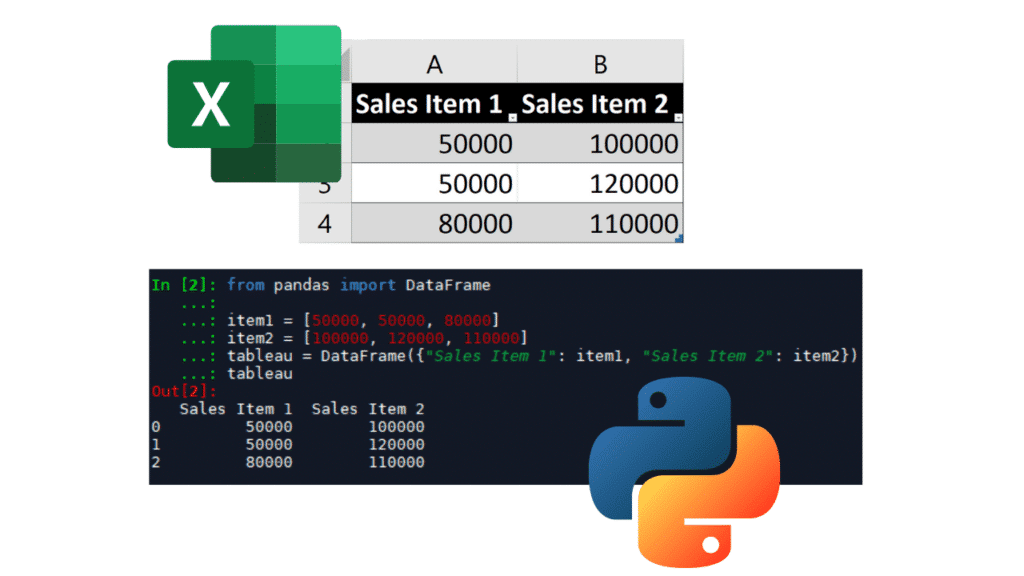
Simply because Python’s great versatility allows it to reproduce quite quickly the main features of Excel: storing values on a row, on a column, on a table, and performing calculations on those same values. You can even use libraries to visualize data, draw graphs… Python has no limits in terms of data analysis.
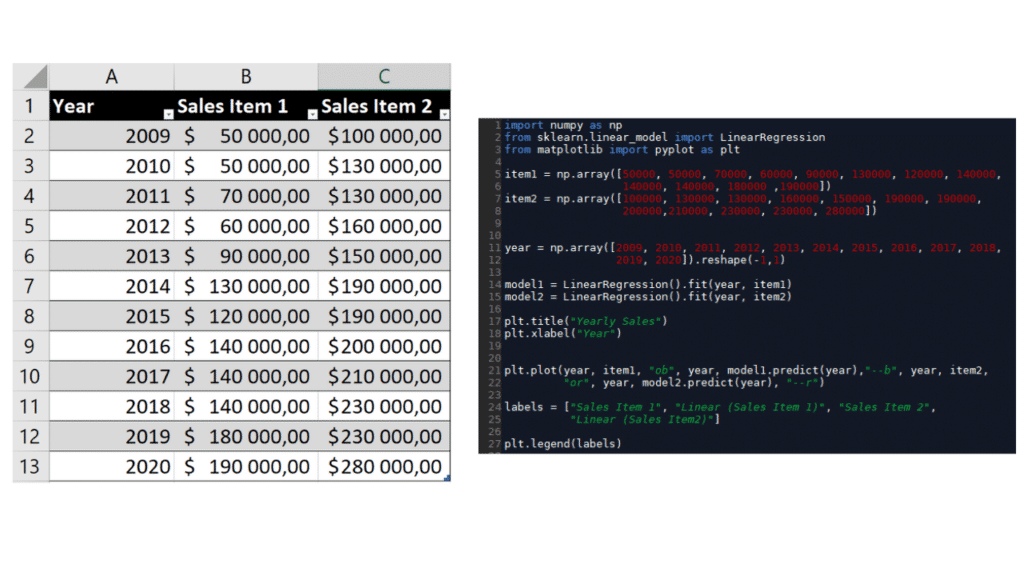
For example, here is a simple linear regression on a Yearly Sales dataset of 2 items:
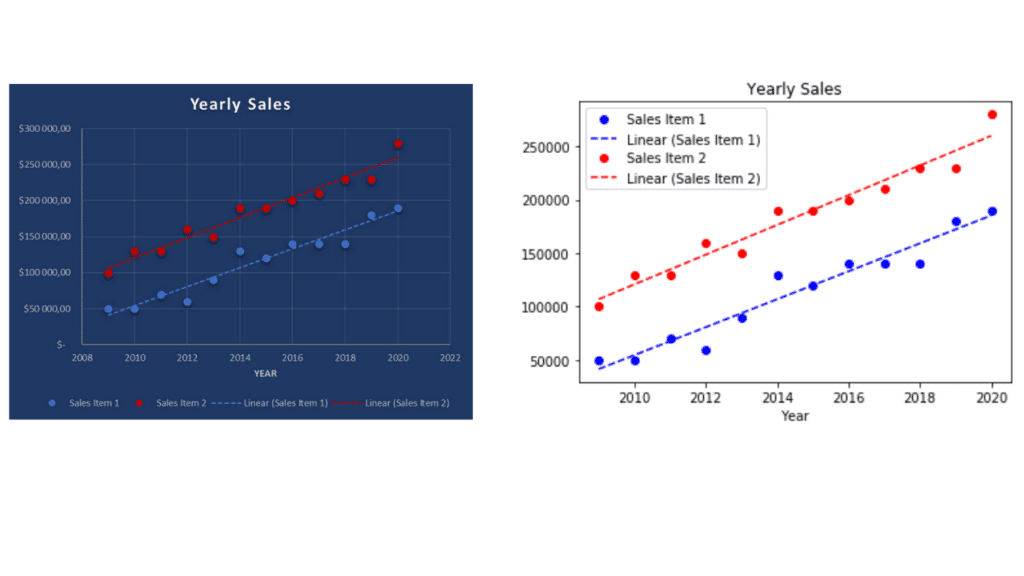
In Excel, all is interactive: we can write down data right away on a table and make the regression with the tendency curve option of Excel graphs. With Python, everything must be coded using open-source packages:
So we can perform data analysis on both tools, but Python is all about programming and development, and is not meant to be used by any random Business User. What could happen in the future is that Automation led by Python programming teams would remove the need to have some tasks performed by Supply Chain professionals on Excel. But it would be a high-level business consequence, not just substituting one software for another at the user level.
Python: more strategic, but more complex
Python is a strategic language in Supply Chain.
The volumes of data managed by companies are only increasing, and supply chain professionals have access to more data in both quantity and variety. The larger the volumes, the more difficult it becomes to manage them with simple desktop tools. Python is an excellent solution for handling large amounts of information. Its computational power is nothing like that of Excel.
It also brings an opportunity to bring more intelligence via Machine Learning algorithms. Python excels in this area.
It has a relatively simple syntax with few lines of code compared to other languages. It is popular in the scientific community, as it benefits from numerous open-source libraries that allow statistical and machine learning models to be applied fairly quickly.
However, Python is much more complex to get to grips with. To give you an order of magnitude, I’d say it takes at least 50 hours of learning to start getting results (assuming you already know how to code!). Since it is only a programming language, it does not have a standard graphical interface of its own and suffers from the comparison with the very intuitive interface of Excel. This was one of my main difficulties when I was starting with Python.

Another crucial point: you won’t have many people around you who can understand and update your programs in Python. Unless you collaborate with a team of Python developers or Data Scientists, the maintainability of your programs will be difficult. And you’ll be on your own when your algorithms crash.
Excel is still evolving
We tend to forget that Microsoft continues to innovate fairly consistently in the features of its office tools. Excel modules such as Power Query and Power Pivot have reached a good level of maturity in recent years.They are particularly well-suited for the issues we encounter in logistics.
Whatever the context in Supply Chain, it is often necessary to go through these 7 steps when analyzing data:
- Import the data
- Clean it up
- Consolidate it
- Shape it
- Set up KPIs and calculations
- Consolidate it on dashboards
- And analyze it to make the right decisions
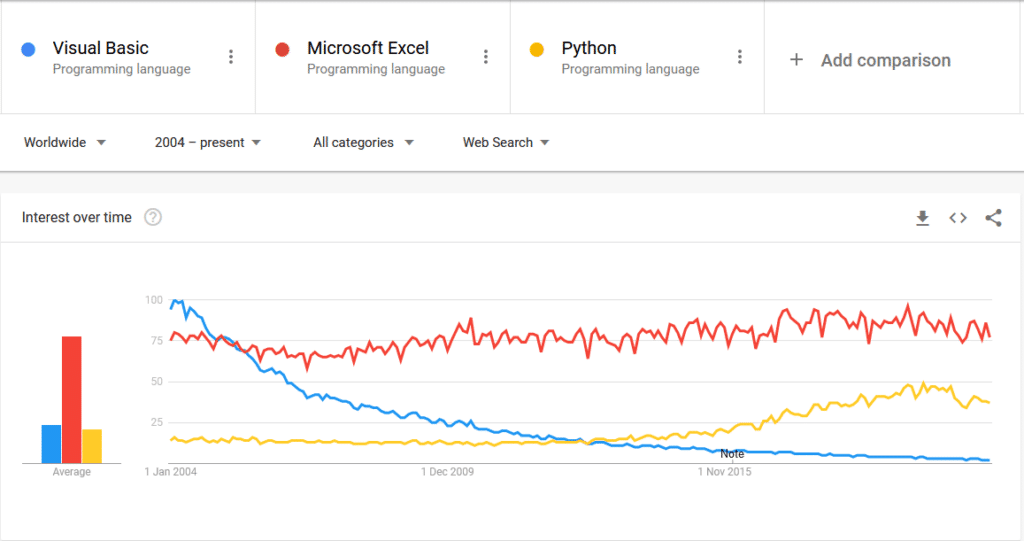
Power Query is used for importing data and Power Pivot for building data models (you can see more details on how they work on the official Microsoft website). So the two modules are very complementary and allow you to automate steps 1 to 4. Many formerly complex automation projects, which required a lot of VBA code, can now be done with much more intuitive tools.
Besides, Power Query and Power Pivot are making Visual Basic Macros obsoletes, which are more complex and less efficient.
We see this clearly on Google search volumes:
So Microsoft Excel still has many years ahead of it. I know from experience that many people do not use it to its full potential, often without realizing it.
Conclusion
So… Python or Excel? We can’t say that one can substitute for the other, because they are two very different tools. Nevertheless, they are comparable in Supply Chain, in the sense that they can be used for the same purposes for extracting, processing and analyzing data from Information Systems. Where Excel provides simplicity, visualizations, and quick analysis, Python offers solutions in terms of scalability, computational power, and complex algorithms.
Depending on your programming level and your business needs, it may be worthwhile to get into Python. However, my speech is always the same, first master the foundations of your business before getting into the complexity.
Start with mastering Excel at a very advanced level and automating as much as possible. Particularly with Power Query/Pivot. This way, you will gain a lot of productivity and stand out in the job market. Only then, if you have an affinity for numbers, you can start training in Python. If you’re a Data Scientist today, obviously you need to master Python, but the majority of Data Scientists I know are already excellent at Excel.
In any case, you should make your own opinion, test Power Query/Pivot and Python for yourself.
To go further
If you want to develop your skills and increase your attractiveness, check out my articles: