Online Supply Chain Analytics Course & Certification
The Practical 8-Step Method and Toolbox to Track and Boost your Supply Chain Performance


4 goals you wish to reach
-
Regain visibility
Gain instant visibility of your supply chains, regardless of the rigid ERP systems.
-
Get clarity
Create beautiful charts and dashboards to visualize data and take action
-
Properly analyze
Obtain error-free formulas, instant graphics, and updated projections with just one click.
-
Improve efficiency
Set-up automatic dashboard that allowed you to make quick decisions and perform.
VS
4 (ineffective) solutions you face
-
Waiting for a reporting tool
The tool does not replace your analysis; start by defining the key indicators yourself.
-
Working more than everyone else
Long hours don’t guarantee success. Burnout often results from prioritizing operations over strategy.
-
Waiting for your ERP/WMS's update
ERP updates sound great but are costly, time-consuming, and often leave teams dependent on Excel anyway.
-
Go through a new Masters degree
Degrees and training help with concepts but often miss the practical skills needed for real-world challenges.


Join 4000+ students from companies like


Why it’s urgent to optimise our supply chain?
Over the past 5 years, inventory has outpaced sales growth across all industries. Meanwhile, the operating margins of companies have declined from 16% in 2012 to 10% in 2022
According to a study by Supply Chain Insights LLC, for the last decade the reasons have been the same:
- Don’t master the various features (Simple & complex formulas, pivot table, Macros, Power Query…)
- Waste time and energy from repetitive tasks
- Spend too much time creating Excel tables, and not enough time analyzing the data in those tables
- Have no results, resulting in daily stress.
How can you effectively enhance your supply chain?
Many professionals lack a comprehensive understanding of supply chain management. Consequently, they often struggle to determine an appropriate starting point in managing the supply chain effectively.
The solution is to get your head out of the water and get to the point immediately with examples and a structured method:
- Select the essential KPIs
- Extract and clean data from your ERP/Software to Excel
- Create an effective dashboard
- Analyze your Dashboard to get straight to the essentials
- Improve your performance and have long-term results
Unlock all the KPIs and Analytics best practices in one place
From Foundations to Expert Level : Master our Method in 8 Steps

Fundamentals: Select the relevant KPIs
Identify essential KPIs (20/80) for your business, Start for quick results (small business focus), Avoid getting lost in details (common in large groups).
Extract and clean data from your ERP/Software to Excel
Identify and extract data from ERP, WMS, or BI without expertise, Clean data automatically in Excel to save time, Achieve reliable data for effective decision-making.
Calculate the indicators: all the rules to practice
Understand calculation rules with examples, Learn KPIs like ABC Analysis, Stock Turn, Obsolete Stock, Create a KPIs map in under 10 minutes.
Créer un tableau de bord
Réaliser un tableau efficace en 2 heures, Design impressionnant pour la direction, Calcul multi-sites et fonctions avancées Excel.
Automate the update and migrate to software
Automate dashboard updates in clicks, Use an efficient Excel structure, Convert reports into specifications for BI or ERP software.
Analyze your Dashboard to get straight to the essentials
Analyze dashboards effectively using Macro/Micro 20/80, Focus on key data with real examples (inventory, forecasts).
Improve your performance and achieve long-term results
Set realistic goals, Empower departments, Stay field-connected, Avoid short-term “firefighting” management.
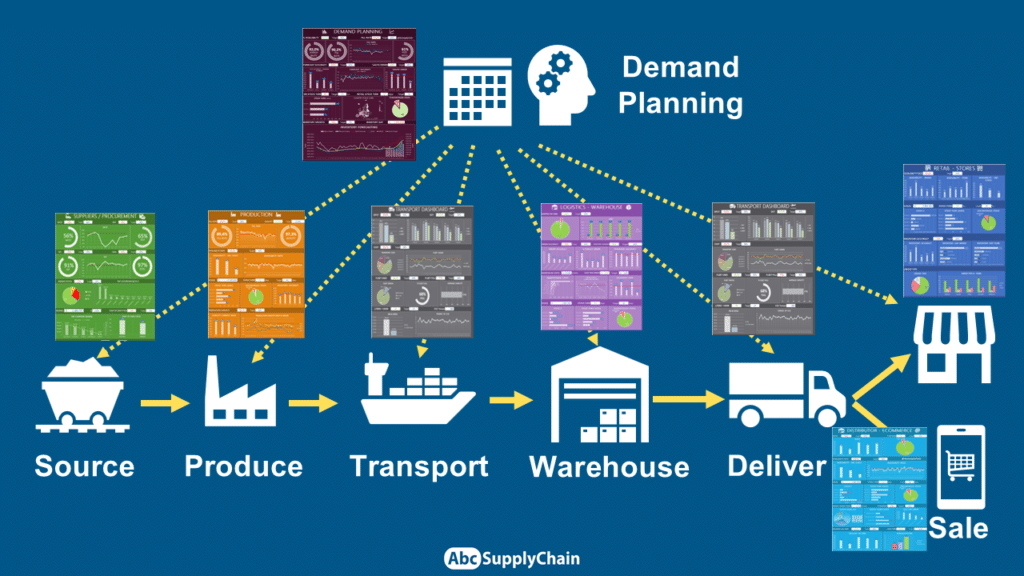
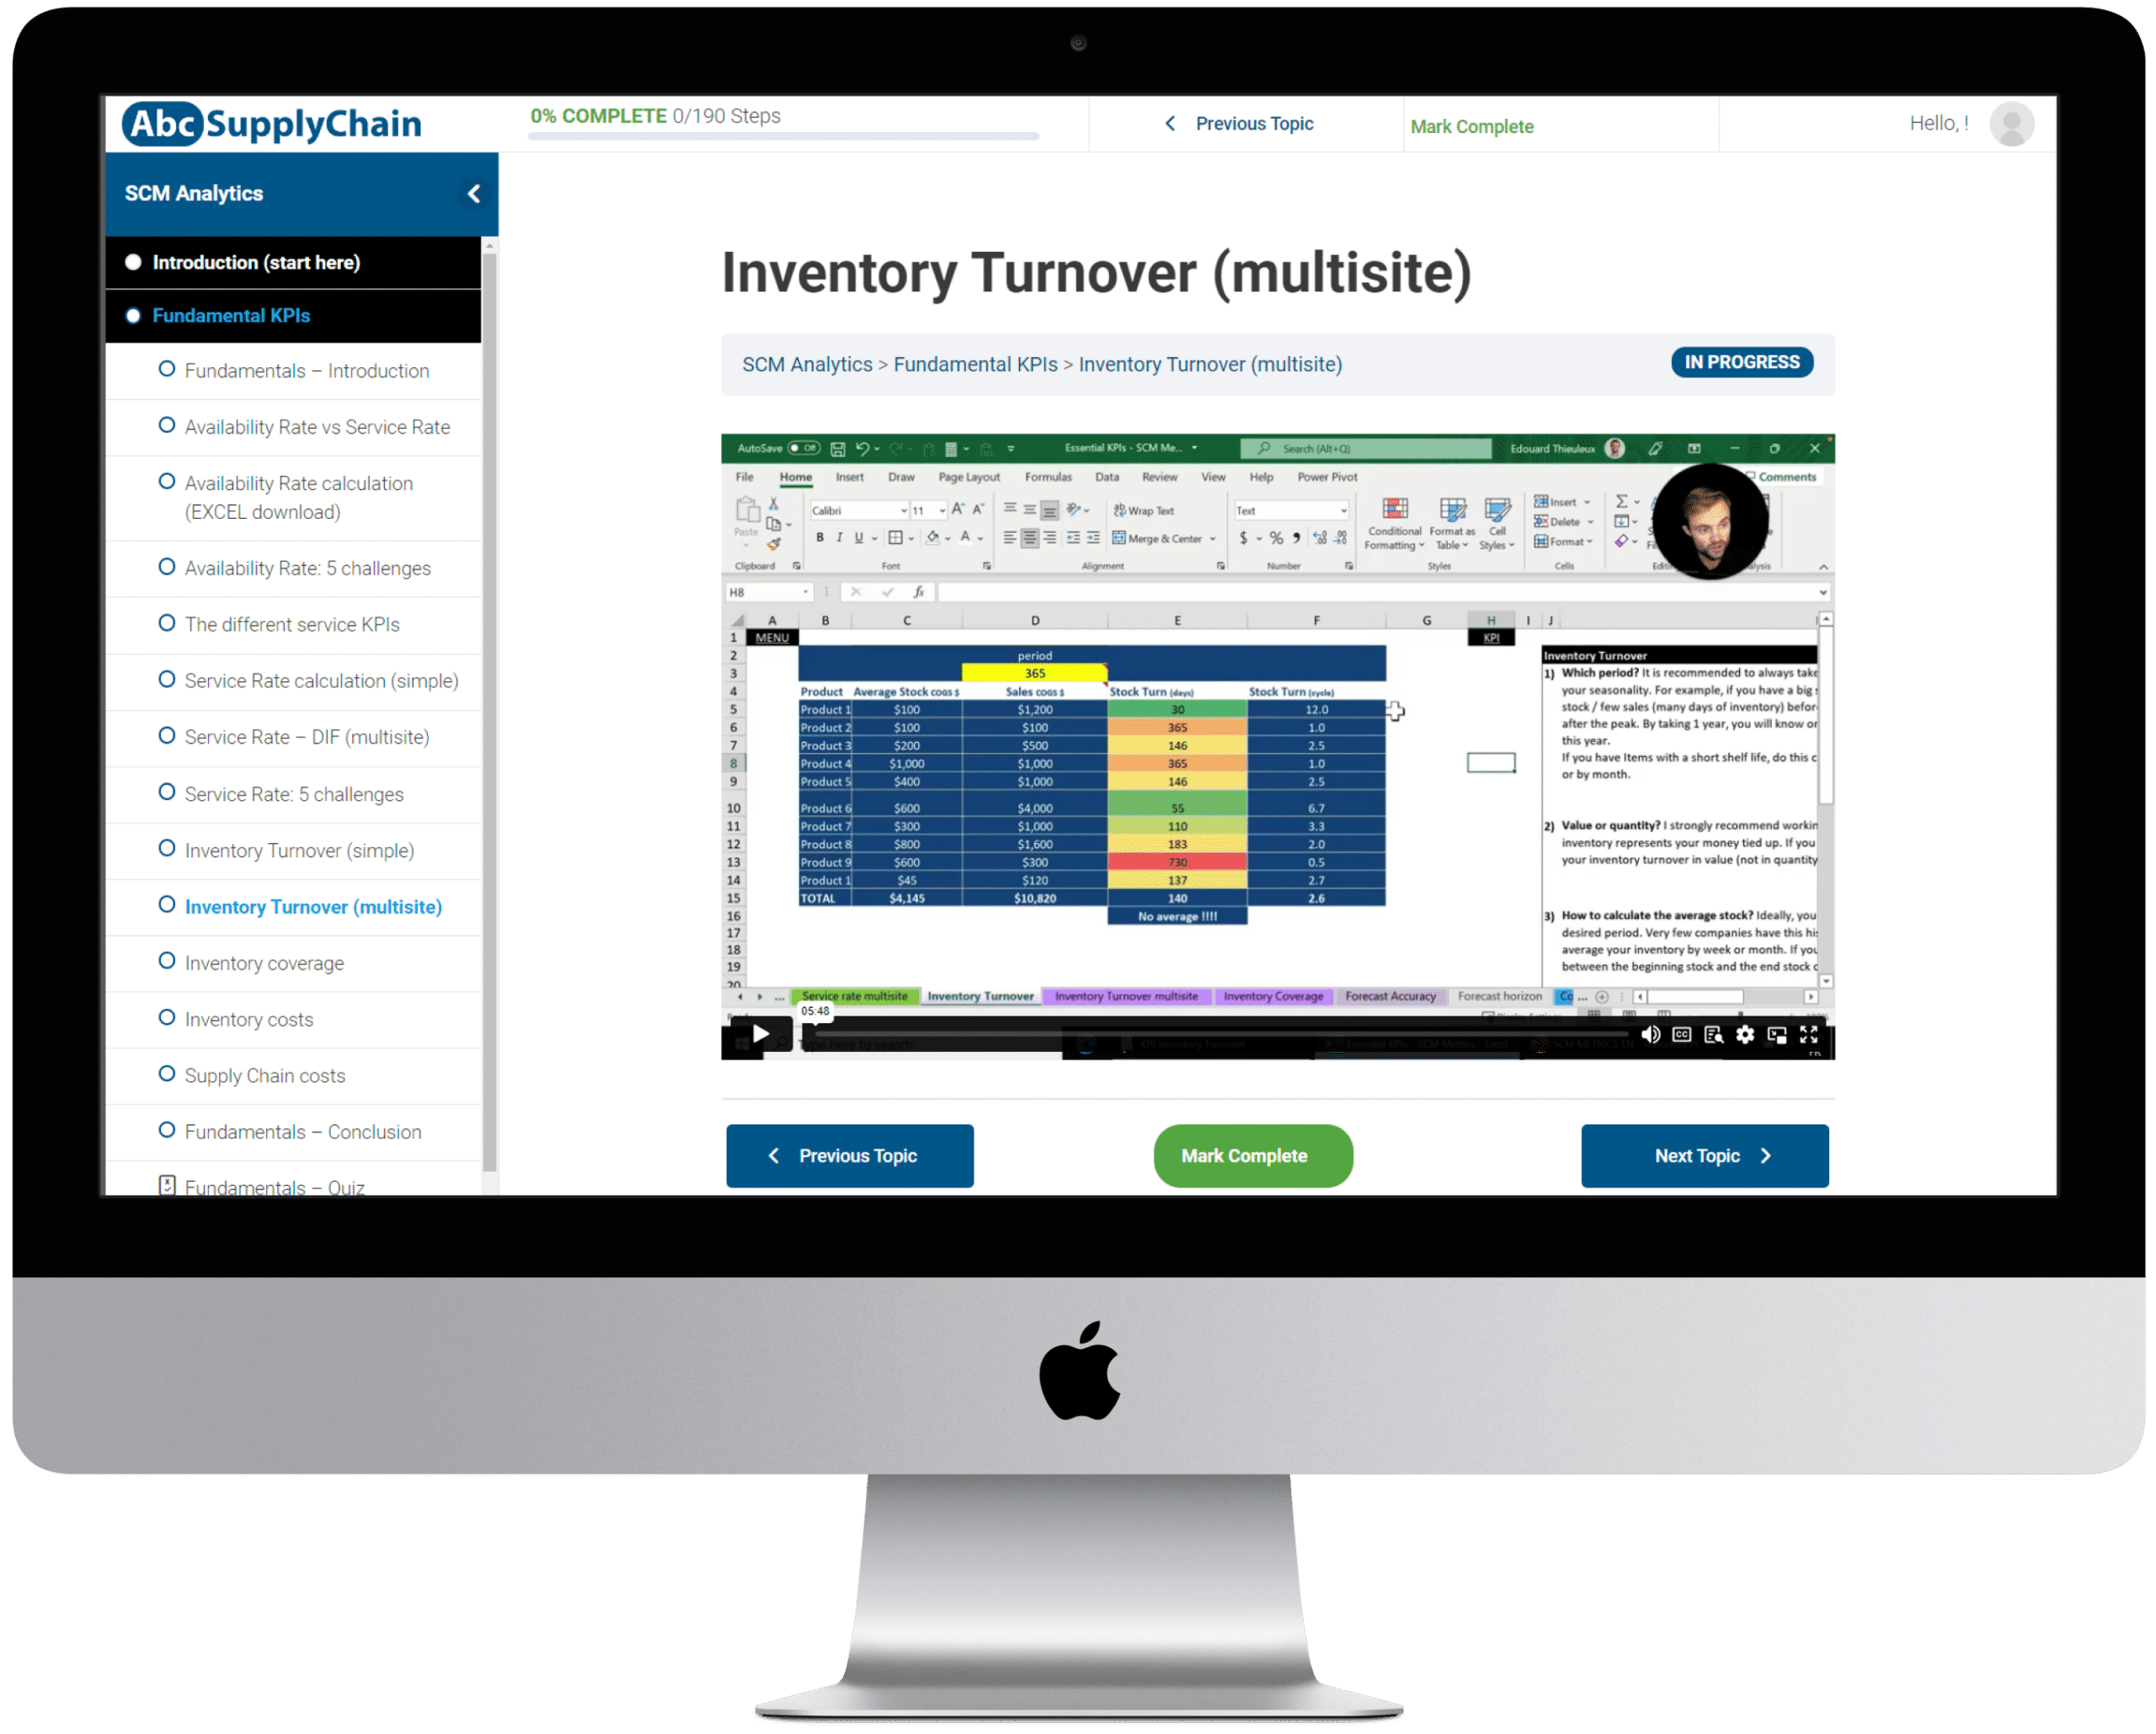
Build the Supply Chain dashboard that will give you instant visibility
Demo video of the dashboards you will build in the course
Who should enroll on SCM Analytics?
This training is ideal for professionals who seek to be more efficient at tracking their Supply Chain, increasing their performance and enabling them to accelerate their career growth.
- Supply Chain Professionals
- Planning and Forecasting Roles
- Leadership and Management Positions
- Data and Analytics Roles
- Consulting and Expertise Roles

Check the full course curriculum
This course will teach you how to turn data into decisions.
- You’ll begin by mastering the essential supply chain KPIs and building clear, impactful dashboards.
- As you advance, you’ll learn how to automate your reporting and drive performance improvements with data-driven insights.
Introduction
- Welcome & Instructions (start here)
- How I became an Expert
- Let’s start with finance
- Different levels of KPIs
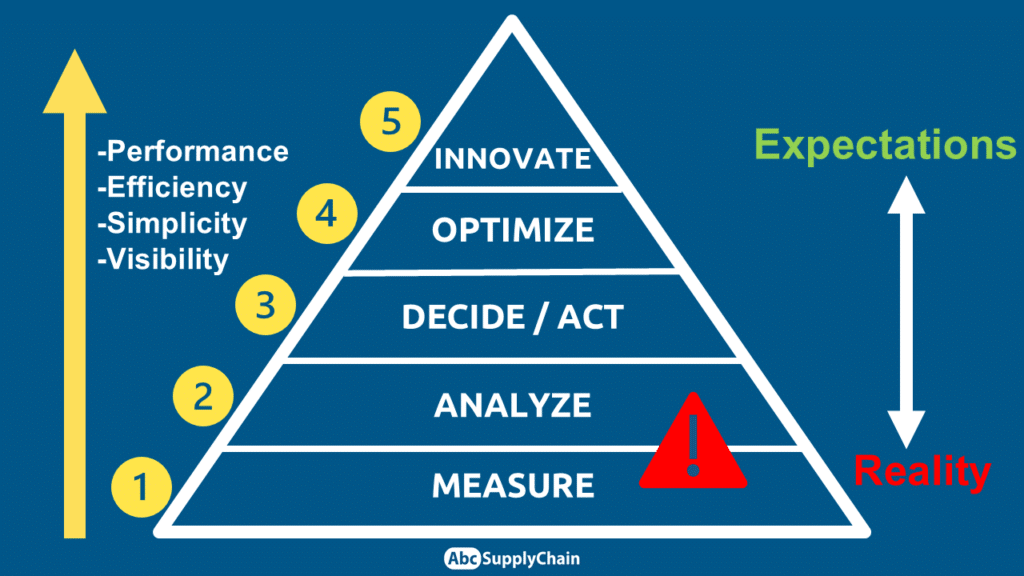
- Performance triangle
- Performance pentagon
- 11 mistakes to avoid
Fundamental KPI's
- Fundamentals – Introduction
- Availability Rate vs Service Rate
- Availability Rate calculation (EXCEL download)
- Availability Rate: 5 challenges
- The different service KPIs
- Service Rate calculation (simple)
- Service Rate – DIF (multisite)
- Service Rate: 5 challenges
- Inventory Turnover (simple)
- Inventory Turnover (multisite)
- Inventory coverage
- Inventory costs
- Supply Chain costs
- Fundamentals – Conclusion
Before building your first dashboard
- Before your first dashboard – Introduction
- Data extraction
- Data accuracy
- Data cleansing (Excel tips)
- Integrate data in Excel
- How to Calculate quickly in Excel
- Power Query introduction (life changing)
- Getting out of Excel (BI & Physical dashboards)
Build your first amazing dashboard (retail)
- Build your first dashboard (EXCEL DOWNLOAD)
- SKU List and Price
- Table Format & Last week stock
- Last weeks sales
- ABC Classification
- Availability Rate
- Stock Turn (Inventory Turnover)
- Obsolete stock
- Inventory Accuracy
- % Manual Order
- Sales Growth YTD – Multi-axis Graph
- Dashboard design – Introduction
- Dashboard design – Graph – Template
- Create Donuts Graphs
- Top 10 Sales/Stock (Exercise)
- Align graph & Define Target
- Insert Dashboard segment
- Update the dashboard
- Analyse and take action!
- BONUS: dynamic MAP KPIs for your site
Your first dashboard with Power Query
- Why Power Query will change your life
- Install and activate Power Query / Power Pivot
- How to fix dashboard links (errors)
- Load a table with Power Query
Download) - Link table from your file in Power Query
- Load the most recent stock period
- Load Sales directly to Pivot table
- How to merge queries (say goodbye to Vlookup)
- Start using Power Pivot – KPIs and data model
- Create a cool Map – USA KPIs
- Create a measure with Power Pivot (Stock Turn)
- Connect all tables with Power Pivot
- Create dashboard with connected slicers
- Table date + Timeline selector
- Refresh the dashboard (while drinking a tea)
- Classic error messages with Power Query (please check)
- How is the Course Going?
Warehouse KPI's
- Warehouse KPIs – Introduction
- Introduction Excel files (EXCEL Download)
- Warehouse Service (SOT)
- SOT Calculation in Excel
- Inventory Turnover + Map
- Occupancy rate
- Inventory accuracy
- Productivity
- Accuracy & Perfect Order Rate
- Warehouse Costs
- Safety Warehouse
- Exercise: Create Occupancy Map
- Conclusion & Update File
Transport KPI's
- Transport KPIs Introduction (EXCEL Download)
- Transport Service (DOT – DOQ)
- Transport Lead Time
- Fleet Status
- Fleet Usage & Capacity
- Consumption & Carbon emission
- Transport Costs
- Transport – Other KPIs
- Conclusion & Update File
Distributor & Ecommerce KPI's
- Distributor & Ecommerce KPIs – Introduction
- Introduction (EXCEL download)
- Availability A & B codes
- Service & DIFOT
- DIFOT calculation in Excel
- Lead Time
- % Return
- Supply Chain Costs
- Conclusion & Update
Production KPI's
- Production – Introduction
- Excel Introduction (EXCEL Download)
- Update Base & Upload Forecast
- ABC Classification using Forecast
- Production Service KPIs
- Fill Rate per item in Excel
- Last 2 years Fill Rate with Power Pivot
- Inventory Turn – Inventory coverage with Forecast
- Factory Occupancy Rate
- Production Efficiency (OEE, ERR)
- Production Capacity
- Components Quality
- Production Cycle Time
- Supply Chain Production Costs
- Conclusion & Update file
Purchasing – Procurement – Sourcing KPIs
- Procurement Introduction (tip of the iceberg)
- Excel Introduction (EXCEL download)
- Supplier ABC classification
- Supplier Service (SIFOT) – Introduction
- DIF (Fill rate in value)
- DOQ (Quality)
- DOT (in value and dynamic %)
- TOP 10 Suppliers delays ($)
- DIFOT Total
- Consolidate all your KPIs per supplier
- Supplier Average Lead Time
- Lead Time Uncertainty level
- Purchase Savings
- Cash-to-Cash Cycle
- Supplier Compliance
- Supplier dependency
- Other procurement KPIs
- Conclusion, Update & Analysis
Demand Planning – S&OP KPIs
- Introduction – Demand Planning
- Excel Files Introduction (EXCEL Download)
- Availability Rate & Service Rate
- Inventory Turnover & Obsolete Stock
- Margin %
- KPIs Map (Europe)
- Forecast Accuracy Introduction
- Forecast Accuracy in Excel (simple)
- Forecast Accuracy Dashboard
- % Automatic Order
- S&OP Introduction
- S&OP Sales Projection
- Inventory Projection
- Offer Profitability (Analysis)
- Conclusion & Update File
Bonus – Demand Planning Dashboard with Power Query
- Excel Introduction: Power Query vs Classic (EXCEL Download)
- Load, Merge & Clean Automatically (life changing)
- Base Consolidation
- Insert new columns & KPIs
- Connect Tables with Power Pivot
- Create New KPIs with Power Pivot
- Update the file automatically
Team KPIs (People)
- Why People matters in the Supply Chain
- Safety
- Justice & Discrimination
- Support & Coaching
- Development plan
- Team Dashboard KPIs (EXCEL Download)
- The best KPI for your team
Planet Impact KPIs
- Why it is important and urgent
- Audit and Certification
- Energy
- Industrial processes
- Transport
- Wastes
- Start the domino effect
Manage and boost your performance
- Get consistent and have long-lasting results
- Few & consistent KPIs
- Why you should not use benchmarks
- Benchmark Database (EXCEL Download)
- How to set Goals
- Share, Educate & Empower
- How to analyze (Macro/Micro – 20/80)
- Stay connected to the field
- Last Recommendations & Future of Reporting
- Go Further!

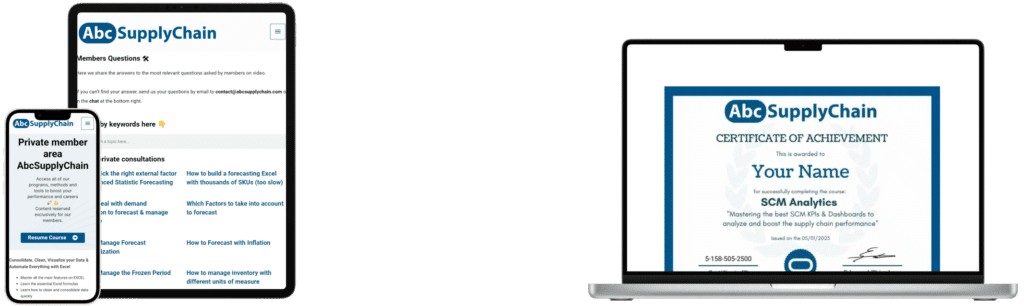
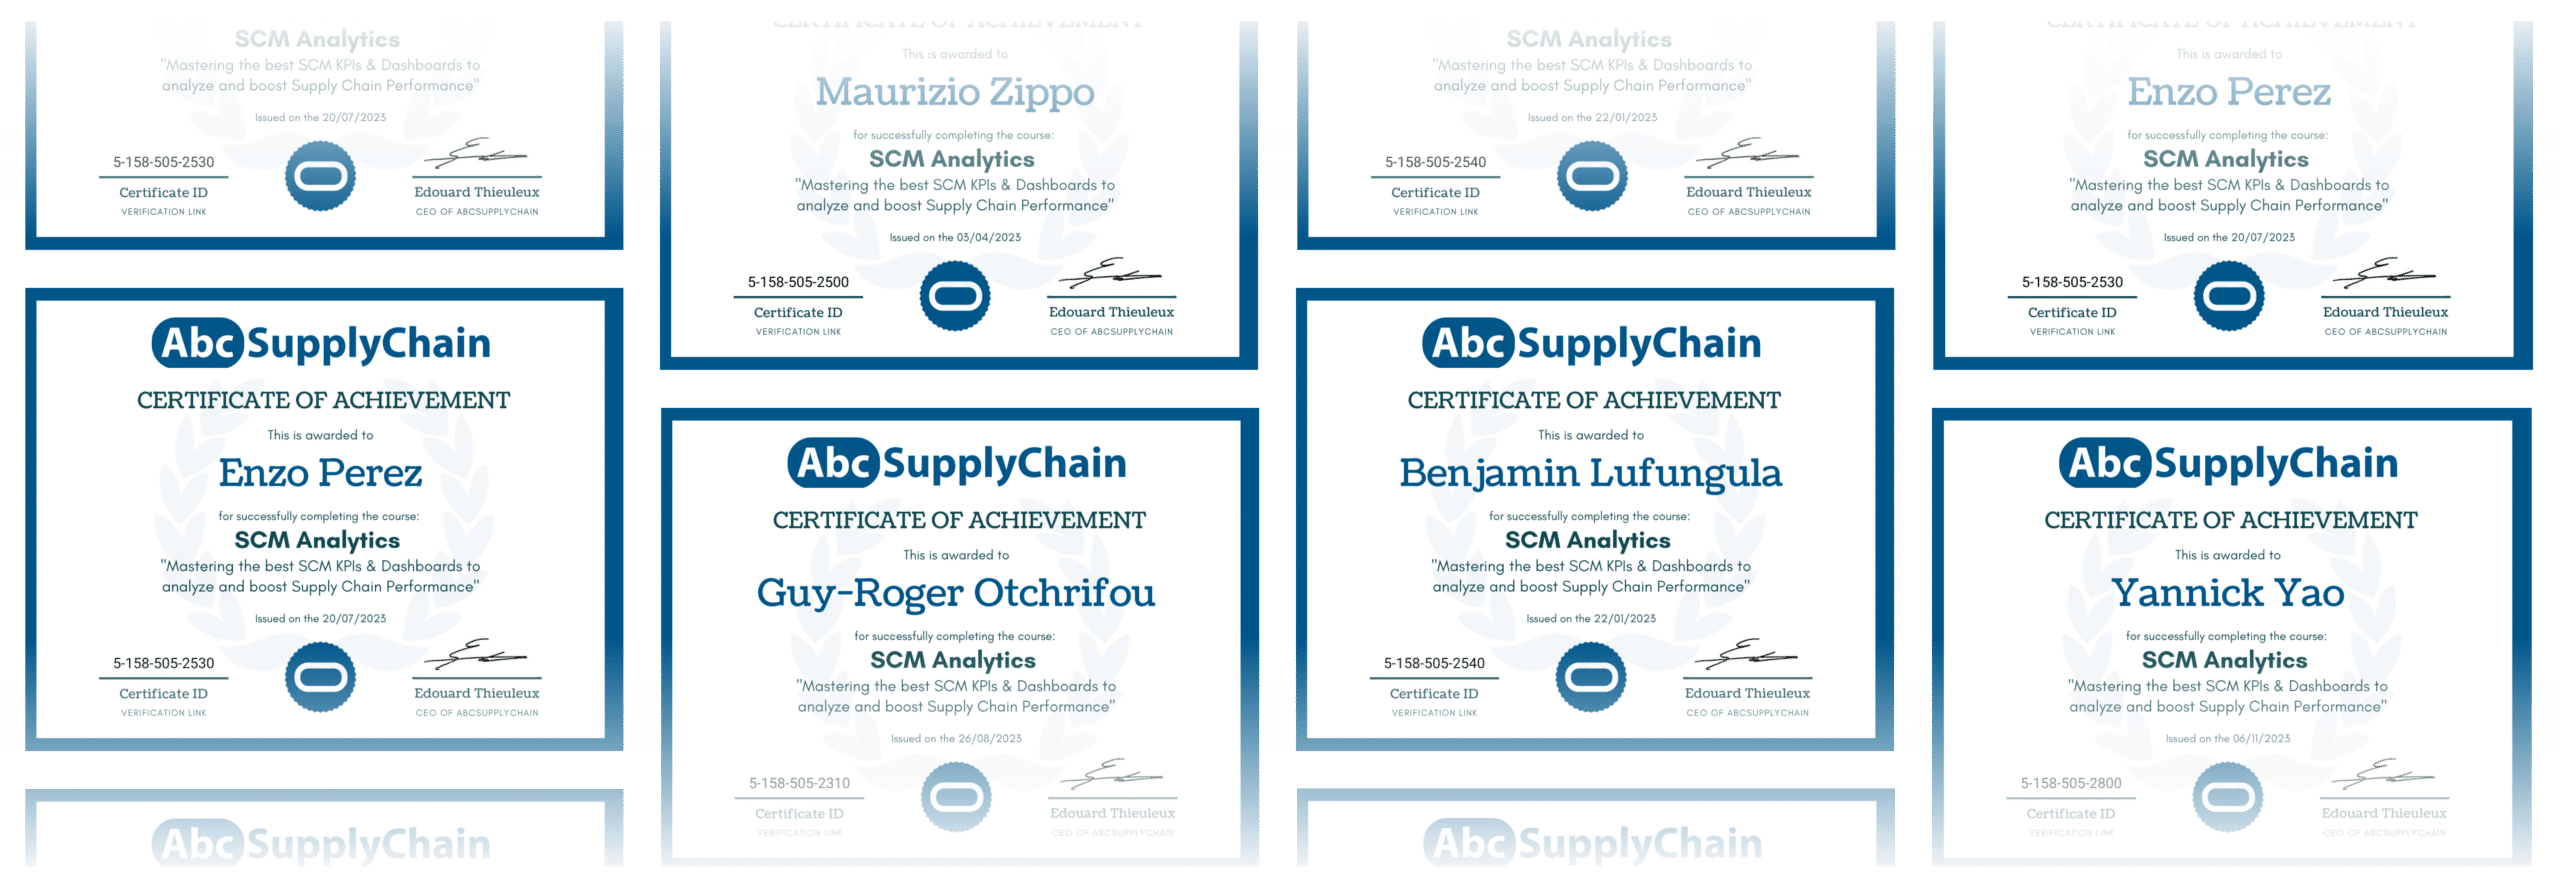
Become part of our 2,000 certified members community.
With Edouard Thieuleux, International Supply Chain Expert
With 15 years of experience in Supply Chain Performance Management, I have held positions as a Supply Chain Manager, S&OP Manager, and Supply Chain Director in various countries and sectors.
“Mastering the skill I teach in my methods has allowed me to make better decisions, outperform my colleagues, and advance in my career.”


Our Different Options
Choose Your Format
*Pricing depends on the number of training selected
Self-Paced
Autonomous Expert & Leader Track – progress at your own pace, independently.
What’s Included:
- Lifetime access to 1 to 6 trainings
- Expert Toolbox & Pratical Method
- Official Certification
- Video Support
Pricing on request after our first call
Consulting and team project
Troubleshoot and regain control of your Supply Chain by combining diagnosis, co-construction, and operational tools.
What we offer
- Diagnosis of your data, files, and methods
- Co-construction workshops with your teams
- Mix of training + solution building by AbcSupplyChain
- Quick wins to manage and structure the Supply Chain
📌 We customize the deliverables and wording to support your internal validation process and ensure alignment with your organization and goals.
Receive the detailed pricing grid based on the number of methods and the coaching format you choose.


Based on 400+ reviews
I recently completed ‘SCM Analytics’ course. This is surely one of the best investments made in my personal development… read more
Edouard, the pedagogy is terrific. The magic structure of the lean learning materials is easy to follow, understand and straight to the point. … read more
This program is designed for anyone who wants to improve their supply chain skills, including:
- Professionals working in supply chain
- Professionals working in purchasing
- Professionals working in logistics
- Professionals working in transportation
- Professionals working in finance
- Professionals working in industry / production
- Professionals working in data science
- Business Analysts
- Supply chain and operations consultants
- Executives (COO, CFO, VP, Directors …)
- Entrepreneurs wishing to optimize their cash flow and turnover
- And all people wishing to make a reconversion in this strategic field
You don’t necessarily need to have a background in supply chain and logistics. This method aims to take you from a foundation level to expert step by step by repeating what I do with examples.
This program will start with an introduction of the main principles before going into more and more detail on techniques and methods.
On the other hand, a beginner level on Excel (basic functions like FindV, Sum, If …) is useful to rebuild the dashboards quickly (I reassure you, I film my screen step by step).
It is also important to have a stable Internet connection and Microsoft Excel installed on your computer.
Once you have registered, you will immediately be emailed access to a site reserved exclusively for program members. There you will find downloadable videos and Excel files organized in modules that cover everything you need to know one by one. We’ll get right down to business with simple examples and methods..
I will also ask you to share with me your professional goals as well as your difficulties and blocks. I will then prepare a video coaching to help you overcome them as well as a direct feedback to improve the visibility of your LinkedIn profile.
We all have different schedules. That’s why our program is based on your availability and your desire to get up to speed quickly. You can log in and progress through the course at any moment and see improvement in the way your forecast after putting in practice the first few lessons.
There are 20 hours content and exercises to apply immediately, because I know your time is valuable and I will get right to the point.
The completion time varies according to your initial level and how much you can apply in your company.
The training is designed to last 8 weeks (4 hours/week) or 4 weeks (8 hours/week) for fast learners
Each module is broken down into short episodes of less than 10 minutes to allow you to progress quickly and at your own pace.
The resources (videos, tools, downloadable files) will be available immediately after your payment has been confirmed and available for life.
The certificate, Excel and Power Point downloads will be also available for life.
Excel 365 is used in this program. The files are compatible with versions 2007, 2010, 2013, 2016, 2019 and office 365 in French and English.
The dashboards will however display slightly differently on excel versions prior to 2013 and MAC version (I will give several alternative solutions if you have a MAC).
You get access to the method in a replay platform, allowing you to go at your rhythm. Some very motivated trainees will go through it in a few days, while others will take a few weeks with less time. I record my screen as I build dashboards in front of you. Then, all you need to do is repeat my actions with your data. Or you can use mine to practice.
After your order, you have 60 days to review the course, apply my advice and decide if it meets your expectations.
If you haven’t progressed, just send an email for a 100% refund.
The only condition to be eligible for reimbursement is to try the techniques that are revealed in this program.
If you would like to certify more than one person from your team and receive team support and additional bonuses.
Please contact us via the team training page to receive a tailored quotation suiting your needs.
Yes, you can join today and not start the program for several weeks or months. Start at your own pace. However, I recommend that you devote at least 30 minutes a week to the program to get quick results.
Short on time or unsure? Start with our free 60-minute MasterClass to gain skills and discover our pedagogy.